The class width calculator simplifies the process of dividing data into intervals, known as classes, which is fundamental in creating histograms and understanding data distributions. By calculating the width of each class, researchers and analysts can ensure that data is evenly distributed across the histogram, making it easier to interpret and analyze.
Formula of Class Width Calculator
To calculate the class width of a data set, follow this simple formula:
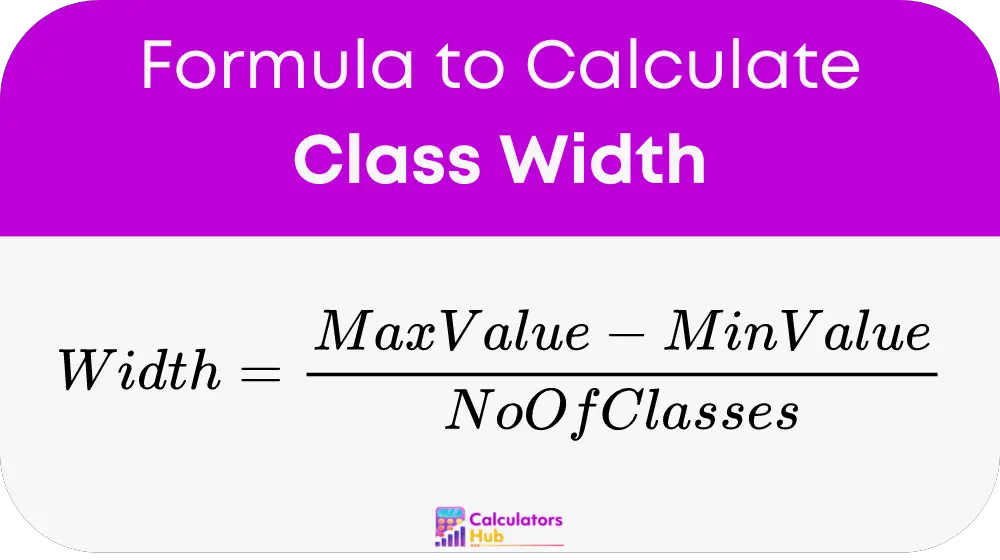
This formula helps determine the interval size for each class by dividing the range of the data (difference between the maximum and minimum values) by the desired number of classes.
Here's what each term represents:
- Maximum value: The highest value in your data set.
- Minimum value: The lowest value in your data set.
- Number of classes: The total number of intervals you want to divide your data into.
Pre-Calculated Table
For your convenience, here is a table with pre-calculated class widths for commonly used ranges and class numbers. This tool allows you to quickly determine the class width without performing manual calculations:
| Range (Max-Min) | Number of Classes | Class Width |
|---|---|---|
| 0-100 | 5 | 20 |
| 0-100 | 10 | 10 |
| 100-200 | 5 | 20 |
| 100-200 | 10 | 10 |
Example of Class Width Calculator
Let's calculate the class width for a data set ranging from 15 to 95 with 5 classes:
- Maximum value: 95
- Minimum value: 15
- Number of classes: 5
- Class width: (95 - 15) / 5 = 16
This example shows how to apply the formula to determine that each class should have a width of 16.
Most Common FAQs
Choosing the number of classes can depend on the size and range of your data. A common method is to use the square root of the number of data points, or to follow Sturges' rule, which suggests using 1 + 3.3 log10(n) classes, where n is the number of data points.
The class width can significantly affect the appearance and interpretability of a histogram. Narrower widths reveal more detail but may lead to clutter, while wider widths provide a clearer overview but may obscure finer details.