The Upper and Lower Fence Calculator is a statistical tool used to identify outliers in a dataset. Outliers are data points that are significantly different from the rest of the data, either being too high or too low. By calculating the upper and lower fences, this tool helps in pinpointing these outliers, ensuring that data analysis is both accurate and reliable.
The importance of this calculator spans various fields, from finance and marketing to healthcare and environmental studies. By identifying outliers, analysts can decide whether to include or exclude these points from their analysis, leading to more precise and meaningful insights.
Formula of Upper and Lower Fence Calculator
To understand how the Upper and Lower Fence Calculator works, it’s crucial to grasp the formulas behind it:
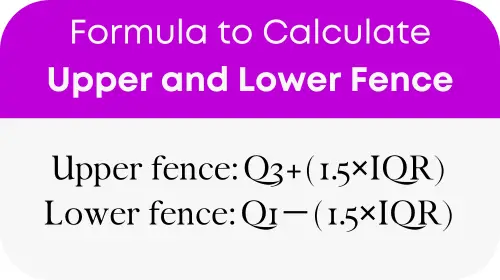
Here’s what each part of the formula represents:
- Q1: The first quartile of your data set. This represents the value that separates the lower 25% of your data from the upper 75%.
- Q3: The third quartile of your data set. This represents the value that separates the upper 25% of your data from the lower 75%.
- IQR (Interquartile Range): The difference between Q3 and Q1. It represents the middle 50% of your data spread.
- 1.5: A constant multiplier used to define how far outliers can deviate from the IQR.
Understanding these components allows users to effectively identify outliers, ensuring data integrity and enhancing analysis quality.
General Reference Table
To facilitate easy understanding and usage, here is a reference table for common situations where the Upper and Lower Fence Calculator can be applied without the need for manual calculations. This table simplifies the process, making outlier identification accessible to everyone, regardless of their statistical background.
| Scenario | Application | Note |
|---|---|---|
| Financial Analysis | Identifying abnormal transactions | Helps in fraud detection |
| Marketing Data | Pinpointing unusual customer behavior | Aids in segmenting customer base |
| Healthcare Statistics | Highlighting unusual patient results | Useful in outlier patient care management |
| Environmental Data | Detecting abnormal environmental readings | Important for anomaly detection in data monitoring |
Example of Upper and Lower Fence Calculator
Consider a dataset where the first quartile (Q1) is 10, the third quartile (Q3) is 30, and the Interquartile Range (IQR) is 20. To find the upper and lower fences, we apply the formulas:
- Upper fence: 30+(1.5×20)=60
- Lower fence: 10−(1.5×20)=−20
Any data points above 60 or below -20 in this dataset would be considered outliers.
Most Common FAQs
A1: Identifying outliers is crucial because they can skew data analysis, leading to inaccurate conclusions. By identifying and managing outliers, you ensure the reliability and validity of your analysis.
A2: This calculator is most effective with continuous data and can be applied across various fields for reliable outlier detection. It’s not as suitable for categorical data.
A3: Not necessarily. Outliers can indicate a problem or an error in data collection, but they can also reveal valuable insights or unique cases worth exploring further.