This calculator determines the probability of seeing a certain number of successes in a sample drawn from a population without replacement. For example, calculating the chances of picking a specified number of defective items from a batch, crucial for ensuring product quality in manufacturing.
Formula of Hypergeometric Probability Calculator
The formula for hypergeometric probability is:
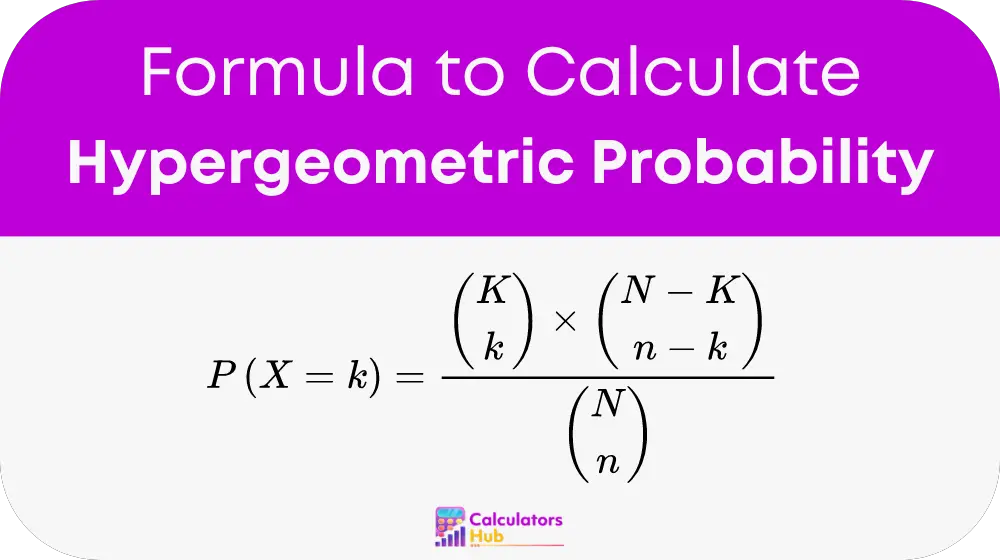
where:
- P(X = k) represents the probability of k successes in n draws.
- C(a, b) is the combination function, defined as C(a, b) = a! / [ b! * (a - b)! ].
- N is the total number of elements in the population.
- K is the number of success states in the population.
- n is the number of draws.
- k is the number of observed successes.
Understanding this formula can significantly improve one's ability to analyze probabilities in complex scenarios.
Table for General Use
Here is a table with common values calculated using the hypergeometric probability formula, serving as a quick reference:
| Total Population (N) | Success States (K) | Draws (n) | Successes (k) | Probability |
|---|---|---|---|---|
| 50 | 10 | 5 | 2 | 0.203 |
| 100 | 20 | 10 | 3 | 0.250 |
| 150 | 30 | 15 | 4 | 0.175 |
This table shows how probabilities change with different population sizes, success states, and draw sizes.
Example of Hypergeometric Probability Calculator
Consider a biologist estimating the probability of finding exactly three rare plants in a sample of ten plants from a larger group of fifty, with five known to be rare. Using the formula with values N=50, K=5, n=10, and k=3, the probability is approximately 0.035.
Most Common FAQs
It measures the likelihood of achieving a specified number of successes in a sample drawn without replacement from a finite population.
It calculates specific outcome probabilities in situations where sampling without replacement, such as in quality control or ecological studies.
The main difference is the sampling method: binomial distribution assumes sampling with replacement, while hypergeometric does not.