The Fixation Index Calculator helps measure population differentiation based on genetic polymorphism. It calculates FST, a statistical value used in population genetics to quantify genetic variance between subpopulations relative to the total population. This value is important for evolutionary biology, conservation genetics, and studies of genetic diversity.
FST values range from 0 to 1:
- 0 implies no genetic differentiation (identical allele frequencies)
- 1 implies complete separation (distinct populations)
Researchers and biologists use this tool to assess how isolated or interconnected different genetic groups are, often for analyzing evolutionary processes, breeding programs, or conservation management.
formula of Fixation Index Calculator
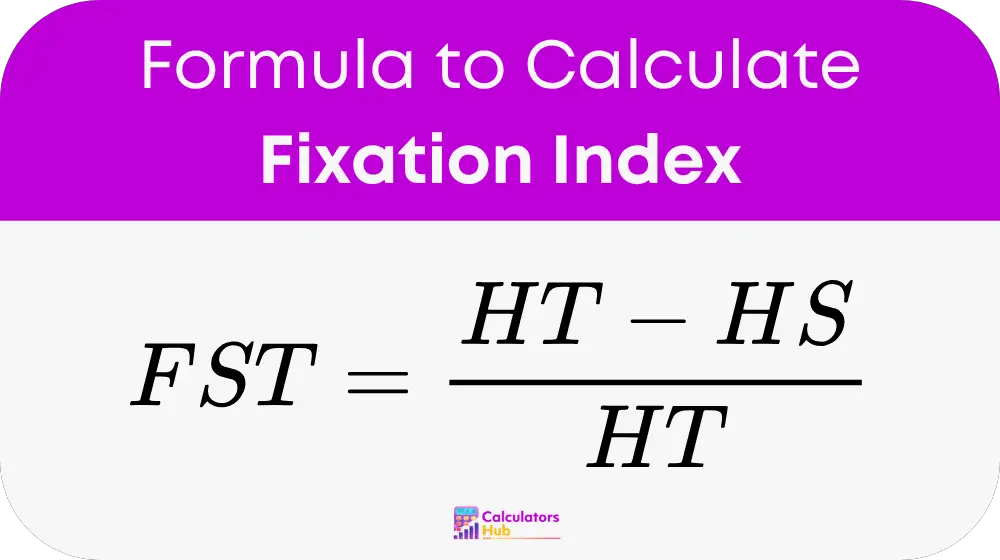
Where:
FST = Fixation Index
HT = Total heterozygosity
HS = Subpopulation heterozygosity
To compute these:
HT = 1 - Σ (p̄ᵢ)²
HS = Average of [1 - Σ (pᵢⱼ)²] across all subpopulations
Where:
p̄ᵢ = Average allele frequency of allele i across all subpopulations
pᵢⱼ = Frequency of allele i in subpopulation j
The summation Σ runs over all alleles at a genetic locus.
FST reveals how much genetic variation can be attributed to population structure. Higher FST values indicate stronger population separation.
Reference Table: FST Interpretation Guide
| FST Value Range | Interpretation |
|---|---|
| 0.00 – 0.05 | Little genetic differentiation |
| 0.05 – 0.15 | Moderate differentiation |
| 0.15 – 0.25 | Great differentiation |
| > 0.25 | Very great differentiation |
This guide is widely use in population genetics studies to assess how isolate subpopulations are from each other in terms of gene flow.
Example of Fixation Index Calculator
Let’s assume we are studying a genetic marker across two fish populations.
- Subpopulation 1: Allele A = 0.7, Allele a = 0.3
- Subpopulation 2: Allele A = 0.5, Allele a = 0.5
Step 1: Average allele frequencies
p̄A = (0.7 + 0.5) / 2 = 0.6
p̄a = (0.3 + 0.5) / 2 = 0.4
Step 2: Calculate HT
HT = 1 - (0.6² + 0.4²) = 1 - (0.36 + 0.16) = 0.48
Step 3: Calculate HS
HS1 = 1 - (0.7² + 0.3²) = 1 - (0.49 + 0.09) = 0.42
HS2 = 1 - (0.5² + 0.5²) = 1 - (0.25 + 0.25) = 0.5
HS = (0.42 + 0.5) / 2 = 0.46
Step 4: Calculate FST
FST = (0.48 - 0.46) / 0.48 ≈ 0.0417
Interpretation: FST ≈ 0.042 suggests little genetic differentiation between the two fish populations.
Most Common FAQs
FST is use to measure the level of genetic differentiation among subpopulations. It helps determine gene flow, evolutionary history, and genetic diversity between groups.
An FST value above 0.25 is consider very high and indicates strong genetic differentiation, possibly due to geographic isolation or reproductive barriers.
Yes. FST estimates can be biase with small or uneven sample sizes. Reliable results often depend on well-balanced and adequately sized populations.