The Chi-square Goodness of Fit Calculator is a statistical tool used to determine if observed data matches expected data. It’s pivotal in fields such as genetics, marketing, and psychology, where understanding distributions is essential. This calculator helps in testing hypotheses about the distribution of data in different categories, thereby facilitating a comparison between the observed frequencies and the frequencies that we would expect to obtain purely by chance.
Formula of Chi-square Goodness of Fit Calculator
To utilize the Chi-square Goodness of Fit Calculator effectively, one must follow a structured approach:
- Set up your data: Organize your data into a table with two columns: one for the observed frequencies (Oi) and another for the expected frequencies (Ei).
- Calculate squared deviations:
- Add a new column for (O – E). This column reflects the difference between observed and expected values for each category. Square the values in this column to get (O – E)².
- Account for expected value: Divide each (O – E)² value by its corresponding expected value (Ei). This step adjusts for categories with higher expected frequencies.
- Sum the chi-square statistic: Add all the values from the previous step. This sum represents the Chi-Square test statistic (χ²).
Formula:
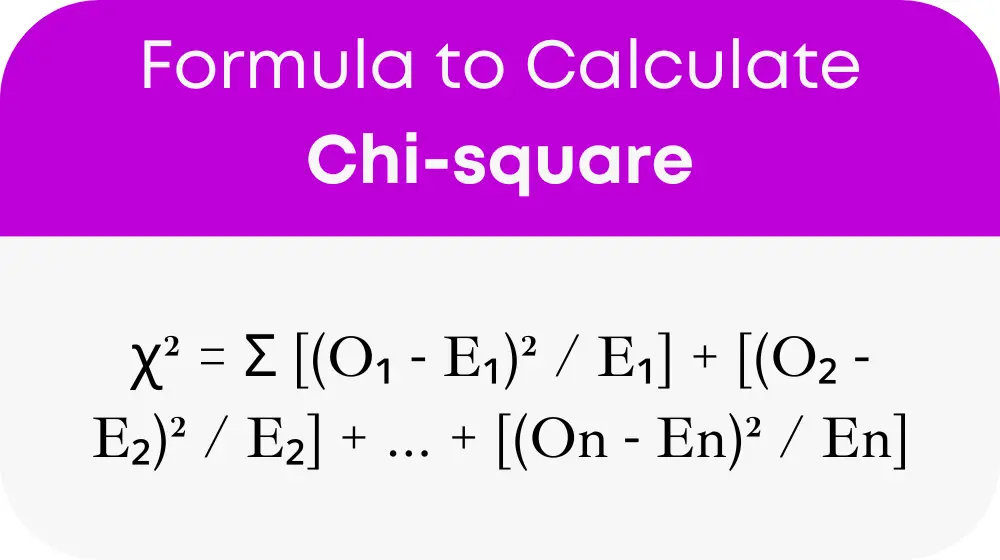
Where:
- χ² (Chi-Square) is the test statistic
- Σ (Sigma) represents summation across all categories
- Oi is the observed frequency for category i
- Ei is the expected frequency for category i
Table for general terms
To further aid understanding and application, we introduce a table for general terms related to the Chi-square Goodness of Fit test, facilitating easy reference without the need for calculations every time.
| Term | Description |
|---|---|
| χ² (Chi-Square) | The test statistic used to measure the difference between observed and expected frequencies. |
| Oi (Observed Frequency) | The actual frequency observed in each category of the dataset. |
| Ei (Expected Frequency) | The theoretical frequency expected in each category, based on a specific hypothesis. |
| Σ (Sigma) | The symbol for summation, indicating that a sum across all categories is to be calculated. |
This table serves as a quick reference to understand key terms and concepts associated with the Chi-square Goodness of Fit test.
Example of Chi-square Goodness of Fit Calculator
Let’s consider an example to illustrate the use of the Chi-square Goodness of Fit Calculator. Suppose a researcher wants to test if a dice is fair. They roll the dice 60 times, recording the frequency of each outcome. The expected frequency for each side (since a dice has six sides) is 10 (60 rolls / 6 sides). The researcher then uses the formula to calculate the Chi-square statistic and compare it with a critical value to determine if the dice is indeed fair.
Most Common FAQs
The Chi-square test helps determine whether there’s a significant difference between the observed and expected frequencies in one or more categories, thereby testing hypotheses about distributions.
It is recommended to use the Chi-square test for larger sample sizes. For small sample sizes, other statistical tests, like the Fisher’s exact test, might be more appropriate.
The critical value depends on the significance level (commonly set at 0.05) and the degrees of freedom, which is one less than the number of categories. This value can be found in Chi-square distribution tables or through statistical software.