A Calibration Curve Calculator is a powerful tool used in analytical chemistry to determine the concentration of an unknown sample based on its instrumental response. It leverages a calibration curve, which is a graph showing the relationship between the measured response (signal) of known concentrations (standards) and their concentration. This relationship is typically linear, allowing for straightforward calculations of unknown concentrations when you input the signal from the sample.
formula of Calibration Curve Calculator
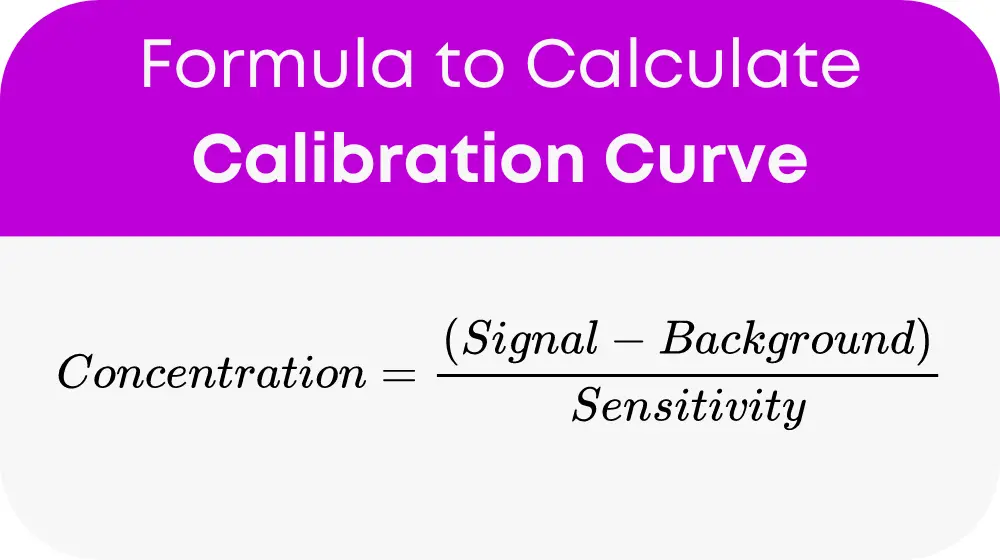
The essential formula for calculating concentration using a calibration curve is:
Let’s break down what each variable represents:
- Concentration: The unknown quantity you’re trying to find, often in parts per million (ppm) or molarity (M).
- Signal (y): The measured response from your sample, with units depending on your specific technique (e.g., absorbance, counts).
- Background (b): The response measured with no analyte present, accounting for noise or interferences. Units should match your signal.
- Sensitivity (a): A factor relating signal change to concentration change, typically the slope of your calibration curve. Choose units so the concentration comes out in your desired measurement.
Table for General Terms
To further simplify the process, below is a table of general terms commonly searched in relation to calibration curves. This table aims to help users understand and utilize the calculator without the need to compute each time manually or to perform necessary conversions.
| Term | Definition |
|---|---|
| Calibration Curve | A graph showing the relationship between the instrument response and known concentrations. |
| Linearity | The degree to which the calibration curve follows a straight line, indicating consistent sensitivity across concentrations. |
| Limit of Detection (LOD) | The lowest concentration of analyte that can be reliably detected, but not necessarily quantitated. |
| Limit of Quantitation (LOQ) | The lowest concentration of analyte that can be quantitatively determined with suitable precision and accuracy. |
Example of Calibration Curve Calculator
Consider you’re measuring a substance’s concentration with an absorbance technique. Your instrument gives a signal of 0.500 units for an unknown sample. The background noise measure at 0.050 units, and from your calibration curve, the sensitivity (slope) is determine to be 0.100 units per ppm. Using the formula:
Concentration = (0.500 – 0.050) / 0.100 = 4.50 ppm
This calculation shows the concentration of the unknown sample is 4.50 ppm.
Most Common FAQs
Start by preparing standard solutions of known concentrations. Measure the response for each using your instrument, and plot these on a graph with response on the y-axis and concentration on the x-axis. The line of best fit through these points is your calibration curve.
While the formula provide assumes linearity, non-linear calibration can also be use with appropriate mathematical models that better fit the data. In such cases, specialize software or calculators are recommend.
If the signal falls outside the range of your calibration curve, it’s crucial to dilute the sample to bring the signal within range or create a new curve that accommodates higher concentrations.