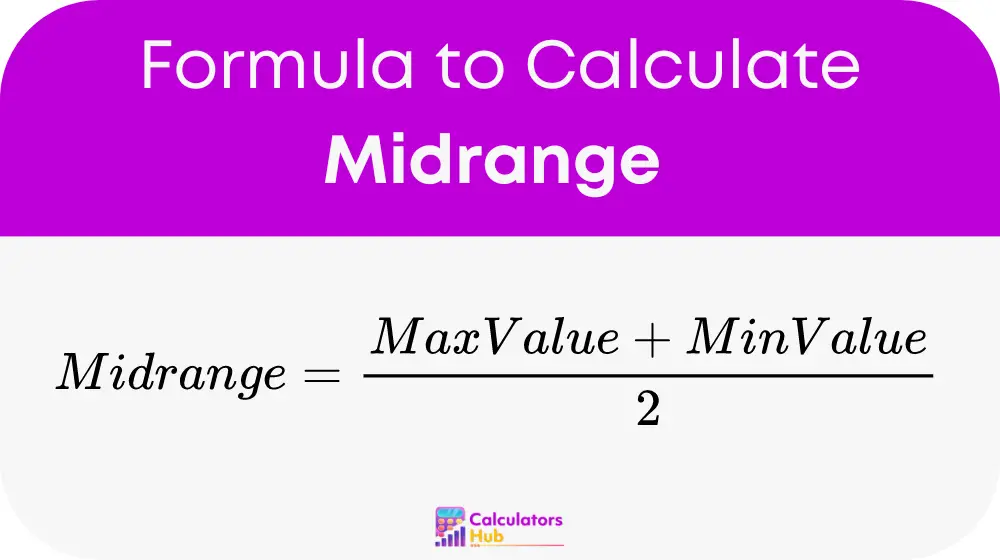
A Midrange Calculator is a simple yet effective tool that helps in statistical analysis by determining the middle value of a data set. This value is calculate by averaging the maximum and minimum observed values. Such calculators are essential in various fields, including statistics, finance, and engineering, where quick estimation of data centrality is required.
Formula of Midrange Calculator
The formula to calculate the midrange is straightforward:

Here’s a breakdown of the formula:
- Maximum value: This is the highest number in your data set.
- Minimum value: This is the lowest number in your data set.
- Midrange: This is the value exactly halfway between the maximum and minimum values.
Practical Utility Table
To enhance practicality, below is a table of general terms and their corresponding midrange values based on common datasets. This table serves as a quick reference to avoid manual calculations each time:
| Data Set Example | Minimum Value | Maximum Value | Midrange |
|---|---|---|---|
| Daily Temperatures (°F) | 50 | 75 | 62.5 |
| Monthly Sales (Units) | 120 | 450 | 285 |
| Exam Scores | 65 | 95 | 80 |
These examples illustrate how the midrange provides a snapshot of central tendency, useful for preliminary data analysis.
Example of Midrange Calculator
Consider a dataset representing weekly hours worked: [40, 42, 38, 44, 36]. The minimum value is 36, and the maximum value is 44. Applying our formula:
Midrange = (44 + 36) / 2 = 40
Thus, the midrange is 40 hours, indicating the central value of our dataset.
Most Common FAQs
The midrange is use as a quick estimate of the central tendency of data, especially in symmetric distributions. It is less commonly use than the mean or median but offers a fast calculation alternative in uniform datasets.
Yes, the midrange can be misleading in skewed distributions as it does not account for the shape of the distribution or the presence of outliers. It is best use in conjunction with other descriptive statistics.
Unlike the median, the midrange is sensitive to outliers because it only considers the extremes of a dataset, which can be significantly influence by outlier values.