The Two Sample Z-test Calculator is a specialized tool designed to help users determine if the differences in the averages of two distinct groups are significant or due to random chance. This test is particularly useful in fields like medicine, psychology, and market research, where making informed decisions based on data is crucial.
Formula of Two Sample Z-test Calculator
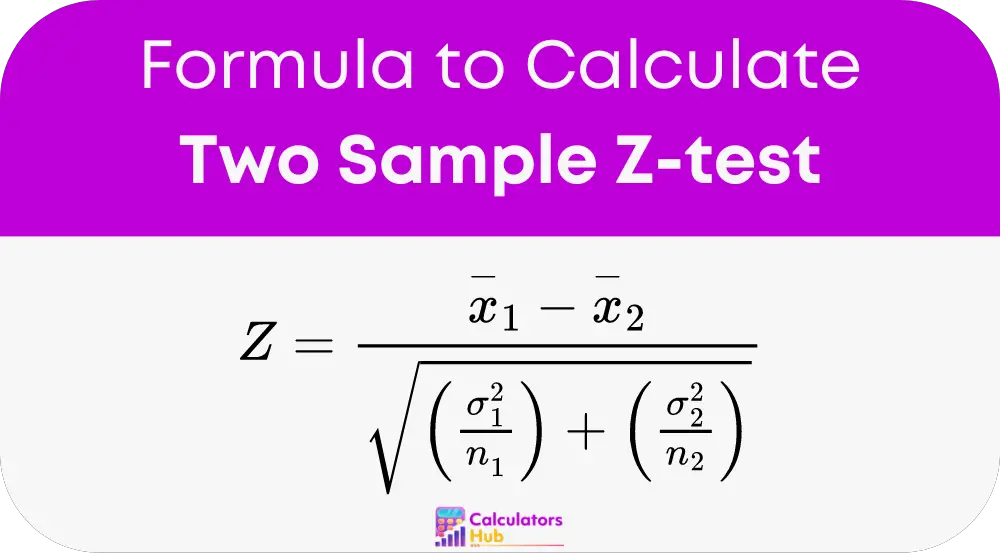
The formula for the Two Sample Z-test is:

Where:
- z is the z-score indicating the number of standard deviations between the group means.
- x̄₁ and x̄₂ are the means of the first and second samples, respectively.
- σ₁ and σ₂ are the standard deviations of the first and second samples.
- n₁ and n₂ are the sizes of the first and second samples.
To conduct a Two Sample Z-test:
- Calculate the mean and standard deviation for each sample.
- Plug these values into the formula to compute the z-score.
- Compare this z-score against the critical value from a z-table, chosen based on your desired level of significance.
Table of General Terms
| Term | Description |
|---|---|
| Mean (x̄) | Average of sample values |
| Standard Deviation (σ) | Measure of data variability |
| Sample Size (n) | Number of data points in a sample |
| Z-Score (z) | Number of standard deviations a data point is from the mean |
| Significance Level (α) | Probability of rejecting the null hypothesis when it is true |
Example of Two Sample Z-test Calculator
Suppose we have two groups of data from different educational techniques aiming to improve student performance. Group 1 has a mean score of 78 with a standard deviation of 10 from 30 students, and Group 2 has a mean score of 82 with a standard deviation of 12 from 35 students. Using a 0.05 significance level, we would find the z-score and compare it to the critical z-value to conclude whether the teaching methods significantly differ in effectiveness.
Most Common FAQs
A1: The Two Sample Z-test is used when the population variances are known and the sample size is large, whereas a t-test is used when variances are unknown and the sample size is smaller.
A2: The choice of significance level (commonly 0.05) depends on how strict you want to be about avoiding Type I errors, where you incorrectly reject the null hypothesis.
A3: Large discrepancies in sample sizes can affect the test’s power. Consider adjusting your data or using alternative statistical methods if the size difference is very significant.