The Difference in Proportions Calculator helps determine the statistical significance of the difference between two proportions from independent samples. This tool is widely used in hypothesis testing, market research, clinical trials, and social sciences to compare categorical data across different groups. By computing the Z-score, users can assess whether the observed difference in proportions is statistically significant or due to random variation.
s="wp-block-heading">Formula of Difference In Proportions Calculator
The formula to calculate the Z-score for the difference in proportions is:
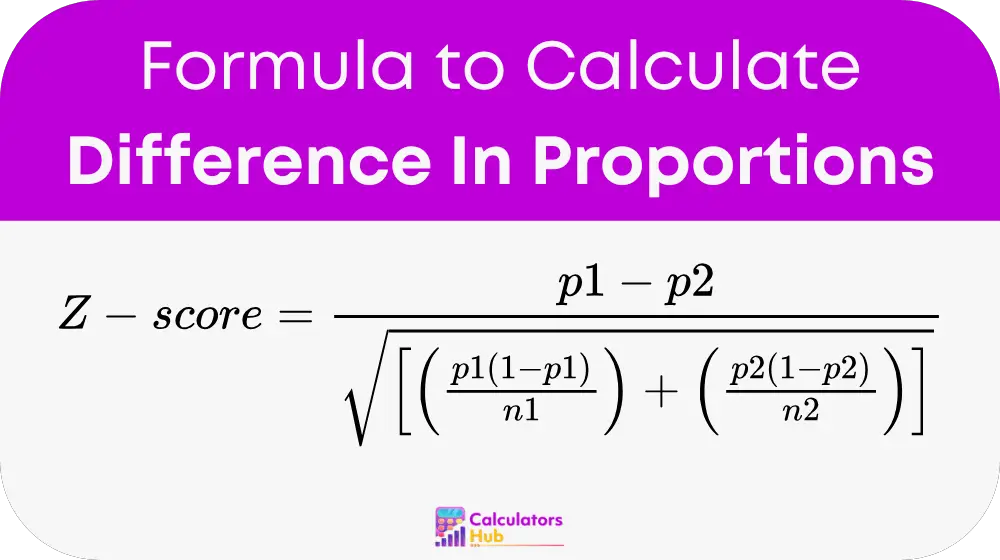
where:
- p1 is the proportion from the first group (x1 / n1)
- p2 is the proportion from the second group (x2 / n2)
- n1 is the sample size of the first group
- n2 is the sample size of the second group
- x1 and x2 are the number of successes in each group
This
formula calculates the standard deviation of the difference in proportions and determines the Z-score, which helps in hypothesis testing.Difference in Proportions Reference Table
This table provides common values for statistical testing and comparison across different sample sizes.
| Sample Size (n1 = n2) | Proportion 1 (p1) | Proportion 2 (p2) | Z-Score |
|---|---|---|---|
| 100 | 0.50 | 0.45 | 0.72 |
| 200 | 0.60 | 0.50 | 2.23 |
| 500 | 0.55 | 0.50 | 1.77 |
| 1000 | 0.70 | 0.65 | 2.20 |
| 2000 | 0.80 | 0.75 | 2.74 |
These values provide a reference for understanding how different proportions and sample sizes affect statistical significance.
Example of Difference In Proportions Calculator
A researcher wants to compare the proportion of customers who prefer two different product designs. Out of 500 customers surveyed for design A, 55% preferred it, while out of 500 customers surveyed for design B, 50% preferred it.
Using
the formula:Z = (0.55 – 0.50) / √[(0.55(1 – 0.55) / 500) + (0.50(1 – 0.50) / 500)]
After calculating, the Z-score is approximately 1.77, which suggests that the difference is close to statistical significance at the 0.05 level.
s="wp-block-heading">Most Common FAQs
Comparing two proportions helps determine if there is a significant difference between them, which is useful in fields like medical studies, surveys, and market research.
A higher absolute Z-score (typically above 1.96 for a 95% confidence level) suggests a statistically significant difference between the two proportions.
Yes, the Difference in Proportions Calculator is frequently used in A/B testing to analyze the effectiveness of different marketing strategies, website designs, and other business experiments.