The Dependent T-Test Calculator is a statistical tool used to compare the means of two related groups, such as pre-test and post-test results, measurements from the same subjects under different conditions, or matched pair studies. It helps determine whether the difference between paired observations is statistically significant. This test is commonly used in research fields like psychology, medicine, education, and business analytics to analyze the impact of interventions or treatments.
Formula of Dependent T-Test Calculator
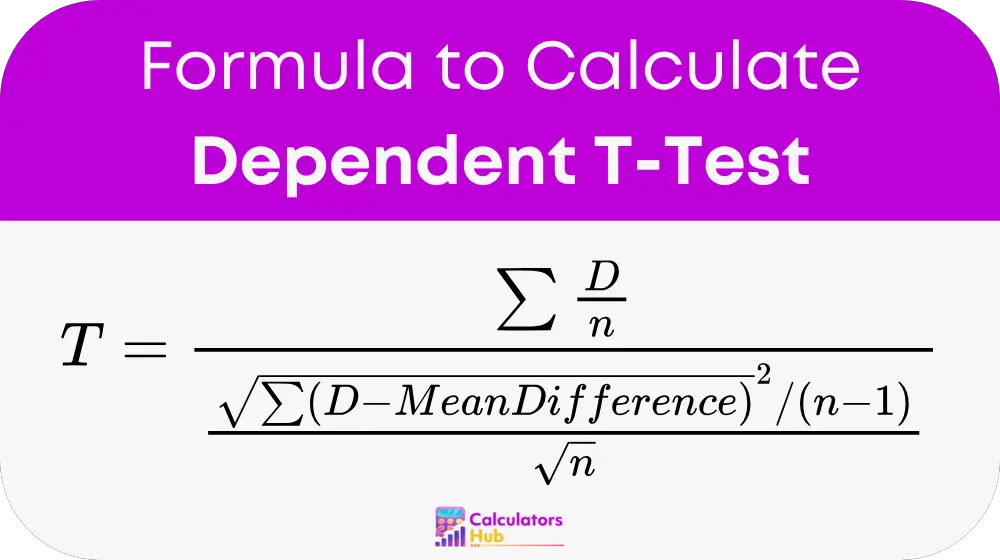
The dependent t-test (also called the paired samples t-test) is calculated using the following formula:
where:
- D is the difference between paired values (Before – After or Group1 – Group2).
- Σ(D) is the sum of all paired differences.
- n is the number of pairs.
- Mean Difference is the average of all differences.
- Standard Error of the Difference is calculated using the standard deviation of differences divided by the square root of n.
This formula helps determine if the observed differences are statistically significant or just due to random variation.
Dependent T-Test Reference Table
This table provides a general guide for interpreting t-test results at common significance levels (α = 0.05 and α = 0.01):
| Sample Size (n) | Critical T-Value (α = 0.05) | Critical T-Value (α = 0.01) |
|---|---|---|
| 5 | 2.776 | 4.604 |
| 10 | 2.262 | 3.169 |
| 15 | 2.131 | 2.947 |
| 20 | 2.086 | 2.845 |
| 30 | 2.045 | 2.750 |
| 50 | 2.009 | 2.678 |
If the calculated t-value is greater than the critical t-value, the difference is statistically significant.
Example of Dependent T-Test Calculator
A researcher wants to test whether a new training program improves employee performance. The researcher records the performance scores of 10 employees before and after training:
| Employee | Before Training | After Training | Difference (D) |
| 1 | 65 | 70 | 5 |
| 2 | 72 | 75 | 3 |
| 3 | 80 | 85 | 5 |
| 4 | 68 | 74 | 6 |
| 5 | 75 | 79 | 4 |
| 6 | 70 | 76 | 6 |
| 7 | 78 | 82 | 4 |
| 8 | 69 | 72 | 3 |
| 9 | 74 | 78 | 4 |
| 10 | 71 | 74 | 3 |
Mean Difference (D̄) = (5 + 3 + 5 + 6 + 4 + 6 + 4 + 3 + 4 + 3) / 10 = 4.3
Using the formula, the researcher calculates the t-value and compares it to the critical value for n=10 at α=0.05 (2.262). If the computed t-value is greater, the training program significantly improves performance.
Most Common FAQs
A dependent t-test is used when comparing two related sets of data, such as before-and-after measurements, matched pairs, or repeated observations on the same subjects.
An independent t-test compares means from two separate groups, while a dependent t-test compares means from the same group under different conditions.
If the calculated t-value is higher than the critical t-value, the result is statistically significant, meaning the observed difference is unlikely to be due to chance.