In statistics, understanding the variability or spread of a population is crucial for accurate predictions and informed decision-making. The Confidence Interval for the Population Variance Calculator is an essential tool that calculates a range within which the true variance of a population is expect to lie, based on a sample from that population. This range is constructed with a specified confidence level, often set at 90% or 95%. This means if the sampling were repeated many times, the confidence interval would include the actual population variance 90 or 95 times out of 100, respectively.
Formula
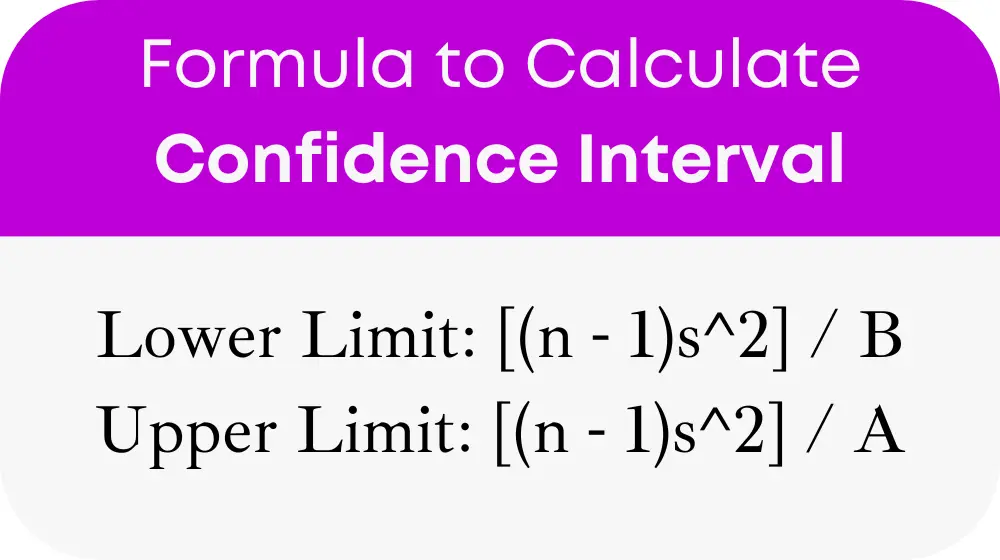
The formula to calculate the confidence interval for the population variance is straightforward yet significant. It involves:

Where:
- n is the sample size.
- s^2 is the sample variance, found by calculating the squared deviations from the mean and averaging them, but with division by n-1 to adjust for sample bias.
- A and B are chi-square values for (n – 1) degrees of freedom. A is associate with the alpha/2 level of significance, indicating the area to the left of A, and B is associate with the 1 – alpha/2 level of significance, indicating the area to the right of B. These chi-square values are determine by the chosen level of significance (alpha) and the sample size (n).
This formula defines a statistical range within which the true population variance is likely to fall, providing a powerful method for estimating population parameters with a predetermined level of confidence.
General Terms Table
Here’s a simplified table of general terms often encountered when using the Confidence Interval for the Population Variance Calculator. This table is intend to make the formula more understandable and its use more straightforward without complex calculations or external references.
| Term | Description |
|---|---|
| n | Sample Size: The number of observations in the sample. |
| s^2 | Sample Variance: The average of the squared differences from the Mean, adjusted with n-1. |
| A, B | Chi-Square Values: Critical values from chi-square distribution, depending on alpha and degrees of freedom. |
| alpha | Significance Level: The probability of rejecting the null hypothesis when it is true, usually set at 0.05 for a 95% confidence level. |
This table summarizes the key concepts necessary to effectively use the Confidence Interval for the Population Variance Calculator.
Example
Imagine a researcher wants to estimate the variance of heights within a population using a sample of 30 individuals. If the sample variance (s^2) is 25 square units and a 95% confidence level is chosen (alpha = 0.05). The formula can compute the confidence interval for the population variance. The chi-square values (A and B) are based on the sample size (29 degrees of freedom) and significance level.
This example shows how the calculator aids in estimating population parameters, providing essential insights for statistical analysis and decision-making.
Most Common FAQs
A Confidence Interval (CI) is a range of values derive from sample data likely to contain the value of an unknown population parameter. The CI provides an estimate of this parameter with a specified confidence level, such as 95%.
Using n-1 instead of n corrects for the bias in estimating a population parameter from a sample. This adjustment ensures a more accurate estimate of the population variance.
The level of significance is chosen base on the confidence desire in the interval’s ability to capture the true population parameter. Common choices are 0.05 for a 95% confidence level and 0.10 for a 90% confidence level. Depending on research context and error risk tolerance.