The Cohort Study Sample Size Calculator is a tool used to determine the number of participants required in each group (exposed and unexposed) to detect a statistically significant difference in outcomes between the groups. Accurate sample size calculation is essential for ensuring the study has sufficient power to identify meaningful differences, while also avoiding unnecessary recruitment efforts or resource expenditure. This calculator is particularly useful for researchers designing cohort studies in fields such as epidemiology, public health, and clinical research. It belongs to the category of statistical and research planning tools.
Formula of Cohort Study Sample Size Calculator
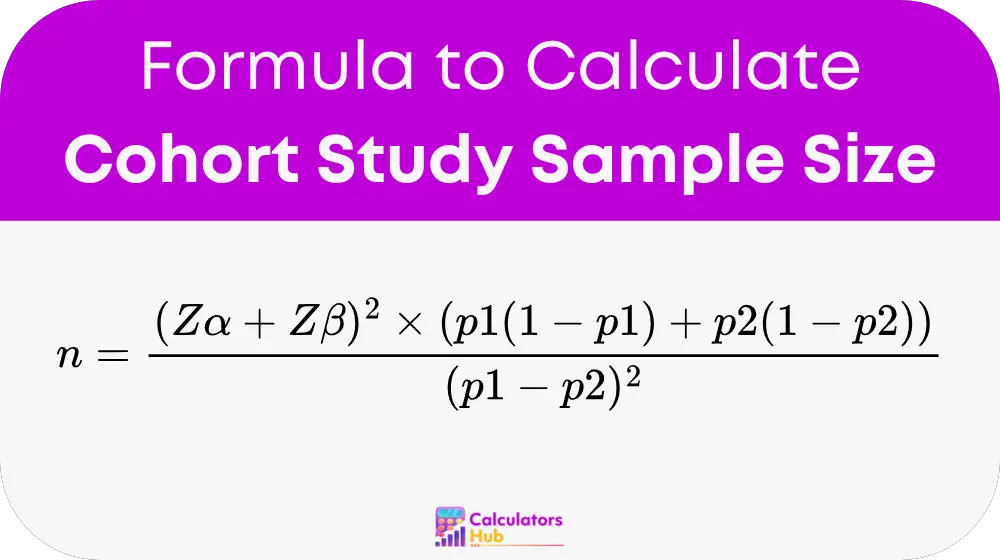
The sample size required for a cohort study is calculated using the formula:

Where:
- n is the required sample size per group (exposed or unexposed).
- Zα is the Z-score corresponding to the chosen significance level (α).
- Zβ is the Z-score corresponding to the desired power (1 – β).
- p1 is the proportion of the outcome in the exposed group.
- p2 is the proportion of the outcome in the unexposed group.
- p1 – p2 is the absolute difference in proportions (effect size).
Detailed Formulas for Variables:
Significance Level (Zα):
Zα = Φ⁻¹(1 – α/2)
Where Φ⁻¹ is the inverse of the standard normal distribution.
Power (Zβ):
Zβ = Φ⁻¹(Power)
Where Power = 1 – β.
Proportions (p1 and p2):
These represent the estimated proportions of the outcome in the exposed and unexposed groups, based on prior studies or assumptions.
Effect Size:
Effect Size = p1 – p2
Total Sample Size:
If the groups are of equal size:
Total N = 2 × n
If the groups are unequal, adjust using a ratio (r) of unexposed to exposed:
- n1 = n
- n2 = r × n
- Total N = n1 + n2
Pre-Calculated Table for Sample Size Estimates
Below is a reference table showing the sample size needed for common scenarios in cohort studies:
| Significance Level (α) | Power (1 – β) | Effect Size (p1 – p2) | Sample Size per Group (n) | Total Sample Size (N) |
|---|---|---|---|---|
| 0.05 | 0.80 | 0.10 | 385 | 770 |
| 0.05 | 0.90 | 0.10 | 506 | 1,012 |
| 0.05 | 0.80 | 0.20 | 97 | 194 |
| 0.01 | 0.80 | 0.15 | 175 | 350 |
| 0.01 | 0.95 | 0.10 | 614 | 1,228 |
This table simplifies planning for studies with common statistical thresholds and effect sizes.
Example of Cohort Study Sample Size Calculator
Suppose a researcher is designing a cohort study to evaluate the association between a risk factor and an outcome:
- Proportion of outcome in the exposed group (p1) = 0.30.
- Proportion of outcome in the unexposed group (p2) = 0.20.
- Desired significance level (α) = 0.05.
- Desired power (1 – β) = 0.80.
Step 1: Calculate Z-Scores
Zα = Φ⁻¹(1 – α/2) = Φ⁻¹(0.975) ≈ 1.96
Zβ = Φ⁻¹(Power) = Φ⁻¹(0.80) ≈ 0.84
Step 2: Calculate Effect Size
Effect Size = p1 – p2 = 0.30 – 0.20 = 0.10
Step 3: Calculate Variance Terms
- Variance for the exposed group: p1(1 – p1) = 0.30 × (1 – 0.30) = 0.21
- Variance for the unexposed group: p2(1 – p2) = 0.20 × (1 – 0.20) = 0.16
Step 4: Substitute Values into the Formula
n = [(1.96 + 0.84)² × (0.21 + 0.16)] / (0.10)²
n ≈ [7.84 × 0.37] / 0.01 = 2,900 / 0.01 ≈ 385
Step 5: Calculate Total Sample Size
For equal group sizes:
Total N = 2 × n = 2 × 385 = 770 participants
This result indicates that the study requires 385 participants per group, or 770 in total, to achieve the desired power and significance level.
Most Common FAQs
Sample size calculation ensures that the study has adequate power to detect meaningful differences between groups, preventing underpowered studies and inefficient resource use.
Key factors include significance level (α), desired power (1 – β), effect size (p1 – p2), and variability in the outcome (proportions p1 and p2).
Yes, the formula can be adjusted to account for unequal group sizes by introducing a ratio (r) of unexposed to exposed participants.