Life Expectancy: 0 years
The Cohort Life Expectancy Calculator is a tool designed to estimate the average number of remaining years a person in a specific cohort (a group of individuals born in the same year or time period) can expect to live. This calculator provides valuable insights for demographers, healthcare professionals, and policy planners to understand population dynamics, health trends, and resource allocation. Unlike period life expectancy, which assumes constant mortality rates, the cohort life expectancy accounts for actual historical and projected mortality rates of a specific group. It belongs to the category of demographic analysis tools and is essential for accurate life expectancy estimations.
Formula of Cohort Life Expectancy Calculator
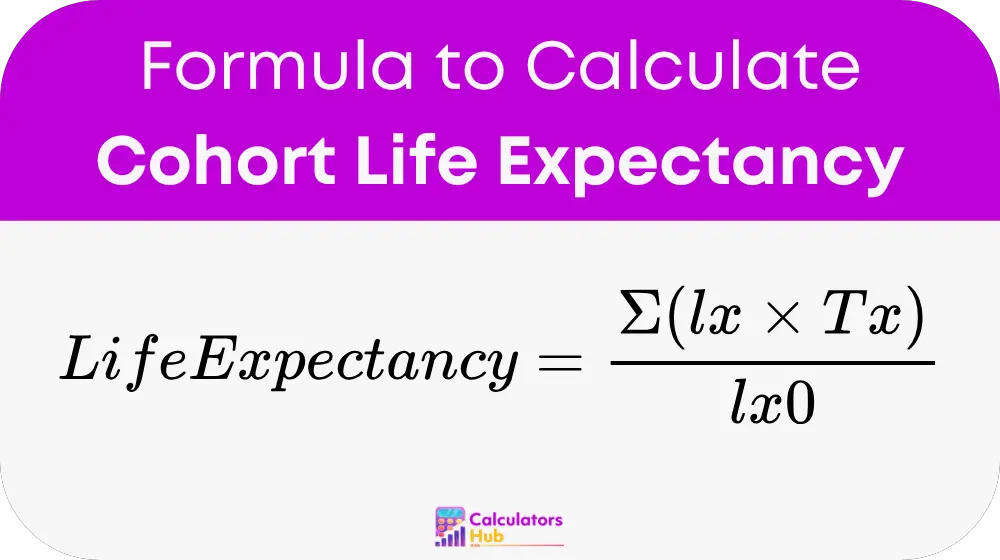
The formula to calculate life expectancy for a cohort is:

Where:
- lx is the number of people alive at the start of age x.
- Tx is the total number of person-years lived by the cohort after age x.
- lx0 is the number of people alive at the start of the cohort (usually at birth, age 0).
Detailed Formulas for Variables:
Number of People Alive at the Start of Age x (lx):
lx = lx-1 × (1 – qx-1)
Where:
- lx-1 is the number of people alive at the start of the previous age group.
- qx-1 is the mortality rate for the previous age group.
Total Number of Person-Years Lived After Age x (Tx):
Tx = ∑ lx for all ages ≥ x
This is the cumulative sum of person-years lived by the cohort from age x onward.
Mortality Rate (qx):
qx = dx / lx
Where:
- dx is the number of deaths occurring in the cohort during the age interval.
- lx is the number of people alive at the start of the age interval.
Life Expectancy at a Specific Age x:
Life Expectancy = Tx / lx
This provides the average remaining years of life for individuals alive at age x.
Pre-Calculated Table for Common Life Expectancy Scenarios
Here’s a reference table to simplify understanding life expectancy calculations based on mortality data:
| Age (x) | Number Alive (lx) | Mortality Rate (qx) | Deaths (dx) | Person-Years (Tx) | Life Expectancy (Ex) |
|---|---|---|---|---|---|
| 0 | 100,000 | 0.02 | 2,000 | 7,800,000 | 78.00 |
| 10 | 98,000 | 0.01 | 980 | 6,800,000 | 69.39 |
| 30 | 95,000 | 0.005 | 475 | 5,000,000 | 52.63 |
| 50 | 90,000 | 0.02 | 1,800 | 3,000,000 | 33.33 |
| 70 | 60,000 | 0.05 | 3,000 | 1,000,000 | 16.67 |
This table helps users quickly interpret life expectancy trends at different ages without complex calculations.
Example of Cohort Life Expectancy Calculator
Let’s calculate the life expectancy for a cohort at age 30 using hypothetical data:
- The number of people alive at age 30 (lx) is 95,000.
- The mortality rate (qx) for the age interval 30–40 is 0.005.
- The total person-years lived by the cohort after age 30 (Tx) is 5,000,000.
Step 1: Calculate Deaths in the Age Interval
dx = lx × qx
dx = 95,000 × 0.005 = 475 deaths
Step 2: Calculate Life Expectancy
Life Expectancy = Tx / lx
Life Expectancy = 5,000,000 / 95,000 ≈ 52.63 years
Thus, individuals alive at age 30 are expected to live an additional 52.63 years on average.
Most Common FAQs
Cohort life expectancy accounts for actual historical and projected mortality rates for a specific group, while period life expectancy assumes constant mortality rates for all age groups in a specific period.
Cohort life expectancy reflects real-world changes in mortality rates over time, such as medical advancements and lifestyle changes, making it a more precise measure of life expectancy.
Yes, but for smaller populations, ensure the data for mortality rates and cohort sizes are accurate to maintain reliability.