The Cochran-Mantel-Haenszel (CMH) Odds Ratio Calculator is a statistical tool designed to assess the strength and direction of the association between two categorical variables while controlling for a confounding variable. This method is particularly useful when data is stratified into groups (strata), such as demographic categories, and a simple odds ratio calculation might be misleading due to potential confounding.
The calculator aggregates odds ratios across strata, providing a single adjusted odds ratio that accounts for variability within groups. It is widely used in epidemiology, public health, and clinical research to determine whether an exposure is consistently associated with an outcome across different groups.
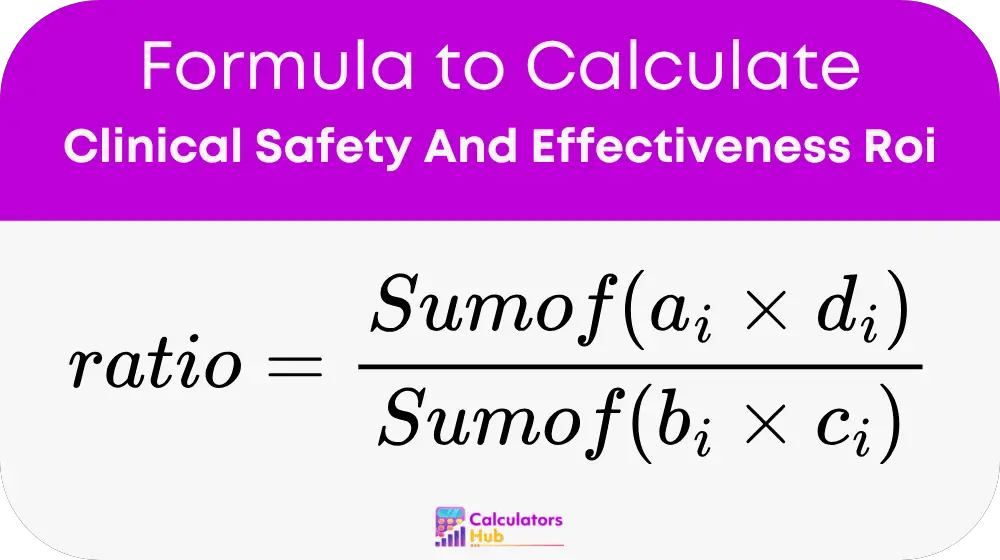
Formula of Cochran-Mantel-Haenszel Odds Ratio Calculator
The Cochran-Mantel-Haenszel Odds Ratio is calculated using the formula:

Where:
- a_i, b_i, c_i, d_i are cell counts in the ith stratum:
- a_i is the number of cases expose in the stratum.
- b_i is the number of controls expose in the stratum.
- c_i is the number of cases not expose in the stratum.
- d_i is the number of controls not expose in the stratum.
- The summation symbol indicates that values are sum across all strata.
Reference Table for Quick Use
Below is a reference table showing typical CMH odds ratios and their interpretation based on the strength of association. These are generic examples to help users quickly interpret results.
| CMH Odds Ratio | Interpretation |
|---|---|
| > 5.0 | Strong positive association |
| 2.0 – 4.9 | Moderate positive association |
| 1.1 – 1.9 | Weak positive association |
| 1.0 | No association |
| 0.5 – 0.9 | Weak negative association |
| 0.1 – 0.4 | Moderate negative association |
| < 0.1 | Strong negative association |
This table is a quick reference for interpreting results but should be apply cautiously with an understanding of the context and sample size.
Example of Cochran-Mantel-Haenszel Odds Ratio Calculator
Consider a study examining the association between smoking (exposure) and lung disease (outcome) across two age groups (strata). The data is stratified as follows:
| Stratum | Smokers with Disease (aᵢ) | Smokers without Disease (bᵢ) | Non-Smokers with Disease (cᵢ) | Non-Smokers without Disease (dᵢ) |
|---|---|---|---|---|
| Age < 50 | 20 | 80 | 10 | 90 |
| Age ≥ 50 | 30 | 70 | 15 | 85 |
Step 1: Calculate a_i * d_i and b_i * c_i for each stratum
For Age less than 50:
- a_i * d_i = 20 * 90 = 1800
- b_i * c_i = 80 * 10 = 800
For Age greater than or equal to 50:
- a_i * d_i = 30 * 85 = 2550
- b_i * c_i = 70 * 15 = 1050
Step 2: Sum across strata
- Sum of a_i * d_i = 1800 + 2550 = 4350
- Sum of b_i * c_i = 800 + 1050 = 1850
Step 3: Calculate CMH Odds Ratio
CMH Odds Ratio = Sum of a_i * d_i / Sum of b_i * c_i CMH Odds Ratio = 4350 / 1850 CMH Odds Ratio is approximately 2.35
Interpretation
The CMH Odds Ratio of 2.35 indicates a moderate positive association between smoking and lung disease after adjusting for age.n between smoking and lung disease, consistent across the two age groups.
Most Common FAQs
Use this method when you want to calculate an odds ratio while controlling for a confounding variable that divides your data into strata. It’s ideal for stratified data where confounding may obscure the true relationship between exposure and outcome.
The CMH Odds Ratio assumes that the odds ratio is consistent across strata. It is not suitable if there is significant variability or interaction between the strata and the exposure-outcome relationship.
Yes, the CMH method can handle multiple strata, making it a flexible and robust tool for analyzing complex datasets with multiple layers of stratification.