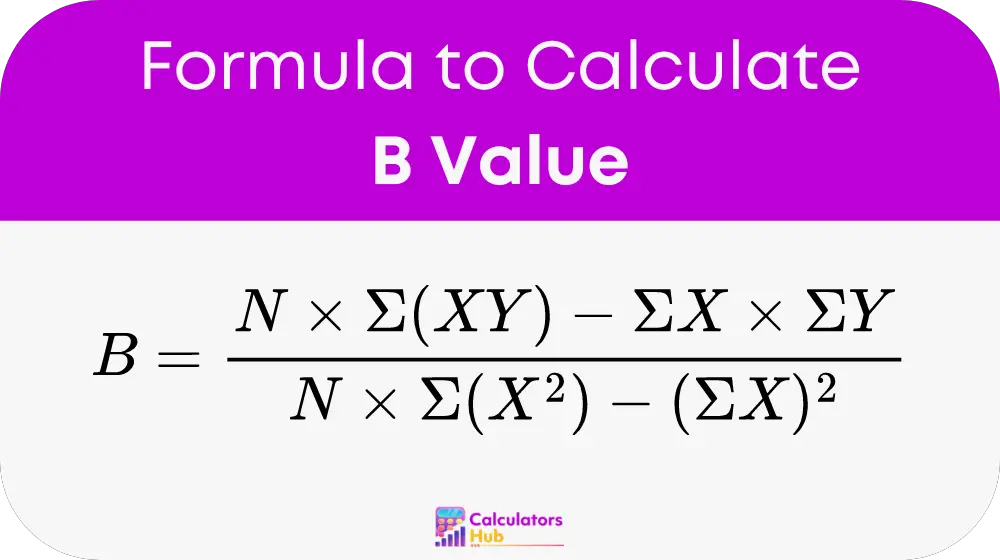
This calculator computes the B value, or slope, of the regression line in linear regression analysis. The B value is a statistical measure that represents the rate of change between two variables, providing insights into how a change in the independent variable X affects the dependent variable Y. This is essential for making predictions based on historical data patterns.
Formula of B Value Calculator
The formula to calculate the B value in linear regression is as follows:

Where:
- B: The slope of the regression line.
- N: The number of data points.
- Σ(XY): The sum of the product of each pair of X and Y values.
- ΣX: The sum of all X values.
- ΣY: The sum of all Y values.
- Σ(X^2): The sum of the squares of X values.
This formula effectively determines how tightly the data points fit the best-fit line, which is pivotal for predicting outcomes.
Table for General Terms
To facilitate a deeper understanding, here’s a glossary of terms commonly associated with the B Value Calculator:
| Term | Definition |
|---|---|
| B | Slope of the regression line in linear regression |
| N | Number of data points |
| Σ(XY) | Sum of the product of paired X and Y values |
| ΣX | Sum of X values |
| ΣY | Sum of Y values |
| Σ(X^2) | Sum of the squares of X values |
Example of B Value Calculator
Consider a dataset with five data points for variables X and Y:
- X: 1, 2, 3, 4, 5
- Y: 2, 4, 5, 4, 5
Using the provided values:
- N = 5
- ΣX = 15
- ΣY = 20
- Σ(XY) = 54
- Σ(X^2) = 55
Plugging these into the formula gives: B = (5 * 54 – 15 * 20) / (5 * 55 – 15^2) = (270 – 300) / (275 – 225) = -30 / 50 = -0.6
This B value of -0.6 suggests that for each unit increase in X, Y decreases by 0.6, indicating a negative relationship between X and Y.
Most Common FAQs
A1: A negative B value indicates an inverse relationship between the independent variable and the dependent variable. As X increases, Y decreases.
A2: The B value’s accuracy directly influences the predictive accuracy of the regression model. A more precise B value leads to more reliable predictions.
A3: The B value is most effective with linear relationships. For non-linear data, other types of regression analysis might be more appropriate.