Hypothesis testing is a foundational method used in statistics to infer the validity of a hypothesis about a population parameter. The Hypothesis Testing Calculator facilitates this process by automating the computations necessary for the t-test, a method used to compare sample means against a hypothesized mean or against each other. Let’s delve into the formulas this calculator uses to execute one-sample and two-sample t-tests.
Formula
One-Sample t-Test
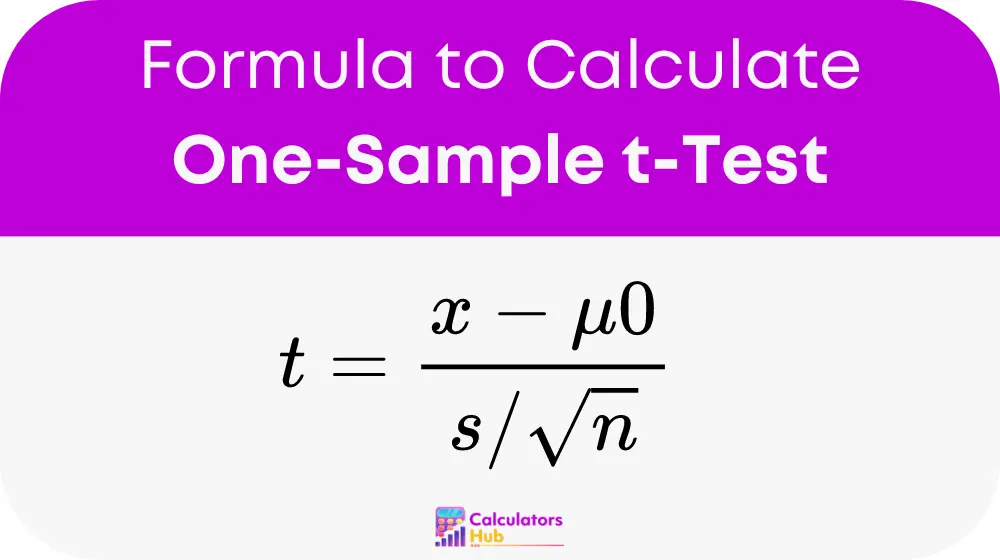
This test is used to determine if the mean (x̄) of your sample is statistically different from a hypothesized population mean (μ₀).

Where:
- t is the test statistic
- x̄ is the sample mean
- μ₀ is the hypothesized population mean
- s is the sample standard deviation
- n is the sample size (number of observations)
Two-Sample t-Test
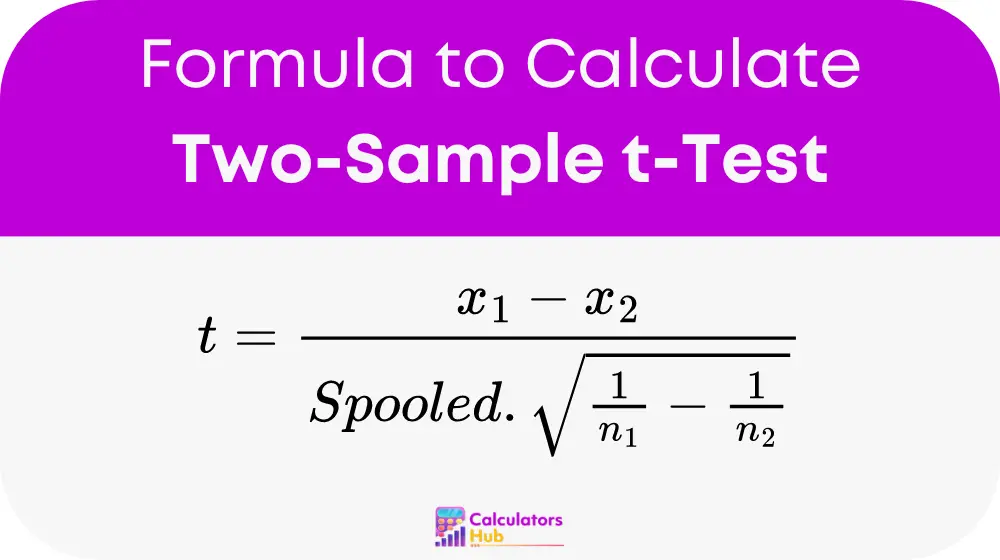
This formula compares the means of two independent groups (x̄₁ and x̄₂), with variations for equal and unequal variances.
Equal Variances:

Where:
- t is the test statistic
- x̄₁ and x̄₂ are the means of the first and second sample, respectively
- s pooled is the pooled standard deviation (calculated from both samples)
- n₁ and n₂ are the sizes of the first and second sample, respectively
Unequal Variances (Welch’s t-Test):
t = (x̄₁ – x̄₂) / (√((s₁² / n₁) + (s₂² / n₂)))
Where:
- t is the test statistic
- x̄₁ is the mean of the first sample
- x̄₂ is the mean of the second sample
- s₁ and s₂ are the standard deviations of the first and second sample, respectively
- n₁ and n₂ are the sizes of the first and second sample, respectively
Table of Critical t-Values
The following table provides critical t-values for different confidence levels and degrees of freedom which are typically use to determine the cutoff points at which the null hypothesis is reject.
| Confidence Level (%) | df=10 | df=30 | df=50 | df=100 |
|---|---|---|---|---|
| 90 | 1.812 | 1.697 | 1.676 | 1.660 |
| 95 | 2.228 | 2.042 | 2.009 | 1.984 |
| 99 | 3.169 | 2.750 | 2.678 | 2.626 |
These values are crucial in hypothesis testing as they help define the threshold for significance, assisting users of the calculator in interpreting their results accurately.
Example
Consider a scenario where a school administrator wants to test if the average test score of the students this semester differs from a hypothesized mean of 70%. Using the one-sample t-test:
- Sample mean (x̄) = 74%
- Hypothesized mean (μ₀) = 70%
- Sample standard deviation (s) = 8%
- Sample size (n) = 36
Using the one-sample t-test formula:
t = (74 – 70) / (8 / √36) = (4 / 1.333) = 3.00
The calculated t-value is 3.00. Using the critical t-values table, at 95% confidence level and 35 degrees of freedom, the critical value is approximately 2.030. Since 3.00 > 2.030, the null hypothesis is reject, indicating a significant difference from the hypothesize mean.
Most Common FAQs
The p-value represents the probability of obtaining test results at least as extreme as the results observed, under the assumption that the null hypothesis is correct. A low p-value (typically below 0.05) indicates strong evidence against the null hypothesis, hence it is usually rejected.
Use a one-sample t-test when comparing the mean of a single sample to a known standard or hypothesized mean. Use a two-sample t-test when comparing the means of two independent groups to see if there is a statistically significant difference between them.
Yes, while the t-test is specifically design for means, the principles of hypothesis testing apply to other parameters such as proportions and variances. Which can also be tested using appropriate versions of hypothesis tests such as the z-test and F-test.