The Invnorm On Calculator computes the inverse of the normal cumulative distribution. This function is pivotal when you need to find a value associated with a particular percentile in a normal distribution. For instance, in quality control processes, determining how much of a product falls below a certain quality threshold often involves inverse normal calculations.
Formula of Invnorm On Calculator
The heart of the Invnorm calculation is the formula:
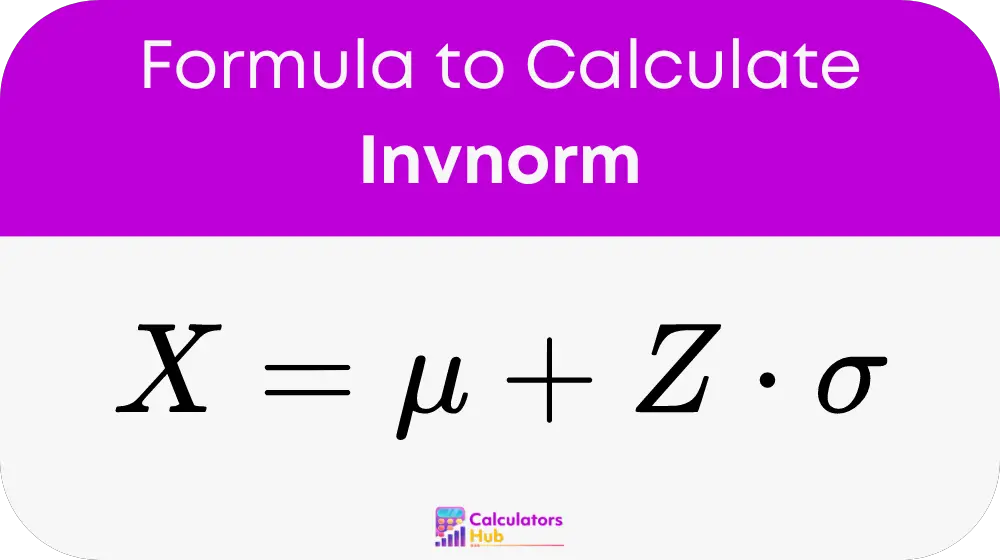
Here, X represents the value you seek, which corresponds to a given cumulative probability in your data set. mu is the mean or average of the distribution, and sigma is the standard deviation, which provides a measure of data dispersion. Z is the Z-score, obtained from a standard normal distribution table, which corresponds to the desired cumulative probability.
Steps to Use the Formula
To effectively use the Invnorm calculator, follow these steps:
- Determine the Mean (mu) and Standard Deviation (sigma): Identify these parameters, which describe your normal distribution.
- Find the Z-Score (Z): Refer to a standard normal distribution table to find the Z-score that matches your cumulative probability.
- Calculate X: Plug in your values for mu, sigma, and Z into the formula to get the desired X value.
Reference Table for Common Values
To facilitate easier calculations, here is a reference table with common Z-scores and their corresponding X values:
| Cumulative Probability | Z-Score | X Value |
|---|---|---|
| 0.01 | -2.33 | 26.7 |
| 0.05 | -1.645 | 33.55 |
| 0.10 | -1.28 | 37.2 |
| 0.25 | -0.674 | 43.26 |
| 0.50 | 0 | 50 |
| 0.75 | 0.674 | 56.74 |
| 0.90 | 1.28 | 62.8 |
| 0.95 | 1.645 | 66.45 |
| 0.99 | 2.33 | 73.3 |
Example of Invnorm On Calculator
Consider a scenario where you need to find the top 5% of measurements from a set of data with a mean of 50 and a standard deviation of 10. Using the Invnorm calculator:
- Z-score for 95% cumulative probability is approximately 1.645.
- Calculate X: 50 + 1.645 * 10 = 66.45. Thus, 95% of the data falls below 66.45.
Most Common FAQs
The accuracy largely depends on the precision of the input parameters (mu, sigma, and Z). With accurate inputs, the calculator provides reliable results.
It is specifically designed for normal distributions. For other distributions, different calculative methods are required.
Double-check your inputs for any errors. Ensure that the Z-score corresponds correctly to the desired percentile.