The Bowley’s Coefficient of Skewness Calculator is a tool used to measure the asymmetry in a data distribution. Skewness indicates whether the data leans more toward the left or the right of the mean. Bowley’s coefficient of skewness is particularly useful for analyzing non-parametric data or distributions where extreme values heavily influence the mean.
Unlike other measures of skewness that depend on moments (such as Pearson’s skewness), Bowley’s method is based on quartiles, making it more robust in the presence of outliers. This method calculates skewness using the first quartile (Q1), third quartile (Q3), and the median. The result gives an understanding of whether the distribution has a longer tail on one side than the other, which can be crucial in fields like finance, economics, and social sciences where data distributions are often skewed.
Formula of Bowley’S Coefficient Of Skewness Calculator
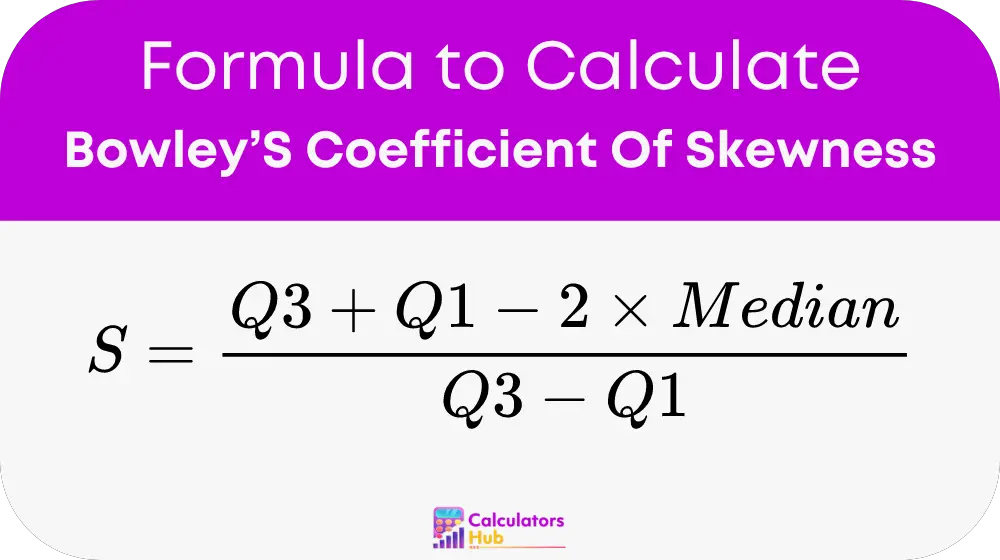
The formula to calculate Bowley’s Coefficient of Skewness is:

Variables:
- S: Bowley’s Coefficient of Skewness, a measure of the asymmetry of the data distribution.
- Q3: Third Quartile (75th percentile), the value below which 75% of the data falls.
- Q1: First Quartile (25th percentile), the value below which 25% of the data falls.
- Median: The median, or 50th percentile, represents the middle value of the data.
Key Points:
- Positive Skewness: If the coefficient of skewness is positive, it indicates that the distribution has a longer tail on the right side, meaning there are more extreme higher values.
- Negative Skewness: If the coefficient is negative, the distribution has a longer tail on the left side, indicating more extreme lower values.
- Symmetry: A skewness value of 0 indicates a perfectly symmetrical distribution, where the data is evenly spread around the median.
Common Terms and Reference Table
Below is a table of terms that will help users better understand Bowley’s Coefficient of Skewness and its application:
| Term | Definition |
|---|---|
| Skewness | A measure of asymmetry in a data distribution. |
| First Quartile (Q1) | The 25th percentile, where 25% of the data is below this value. |
| Third Quartile (Q3) | The 75th percentile, where 75% of the data is below this value. |
| Median | The middle value of a dataset, where 50% of the data is below and 50% is above. |
| Positive Skewness | A distribution with a long tail on the right side, with higher extreme values. |
| Negative Skewness | A distribution with a long tail on the left side, with lower extreme values. |
| Interquartile Range (IQR) | The range between the first quartile (Q1) and the third quartile (Q3). |
Example of Bowley’S Coefficient Of Skewness Calculator
Let’s walk through an example to show how to calculate Bowley’s Coefficient of Skewness using real data. Suppose you have the following quartiles and median for a dataset:
- First Quartile (Q1) = 25
- Third Quartile (Q3) = 75
- Median = 50
Step 1: Apply the Formula
Bowley’s Coefficient of Skewness (S) = (Q3 + Q1 – 2 × Median) ÷ (Q3 – Q1)
Substitute the values:
S = (75 + 25 – 2 × 50) ÷ (75 – 25)
Step 2: Calculate
S = (75 + 25 – 100) ÷ 50
S = 0 ÷ 50 = 0
In this case, the skewness is 0, indicating that the data distribution is perfectly symmetrical, with no skewness in either direction.
Most Common FAQs
Bowley’s Coefficient of Skewness provides a measure of the asymmetry of a data distribution. A positive value indicates that the distribution has a longer right tail (more extreme high values), while a negative value indicates that the distribution has a longer left tail (more extreme low values). A value of zero indicates a symmetrical distribution.
Bowley’s method is based on quartiles, which are less sensitive to outliers than mean-based skewness measures. This makes it particularly suitable for non-parametric data or distributions that are skewed by extreme values.
While Pearson’s skewness is based on the mean and standard deviation, Bowley’s skewness relies on quartiles and the median. Bowley’s method is more robust when dealing with skewed or non-normal data, as it is less influenced by extreme values (outliers).