The Expected Shortfall Calculator is a financial risk tool that helps estimate the average loss that could occur beyond a specific Value at Risk (VaR) threshold. While VaR tells you the worst-case loss at a given confidence level (like 95% or 99%), Expected Shortfall (ES) goes a step further. It looks at how severe losses could be if you cross that VaR limit.
This tool is useful for banks, investors, insurance firms, and risk managers who need a more complete picture of potential losses in rare but extreme market events. Unlike VaR, which can underestimate tail risks, Expected Shortfall captures the average of losses that lie in the worst percent of cases—making it a more reliable indicator for managing financial uncertainty.
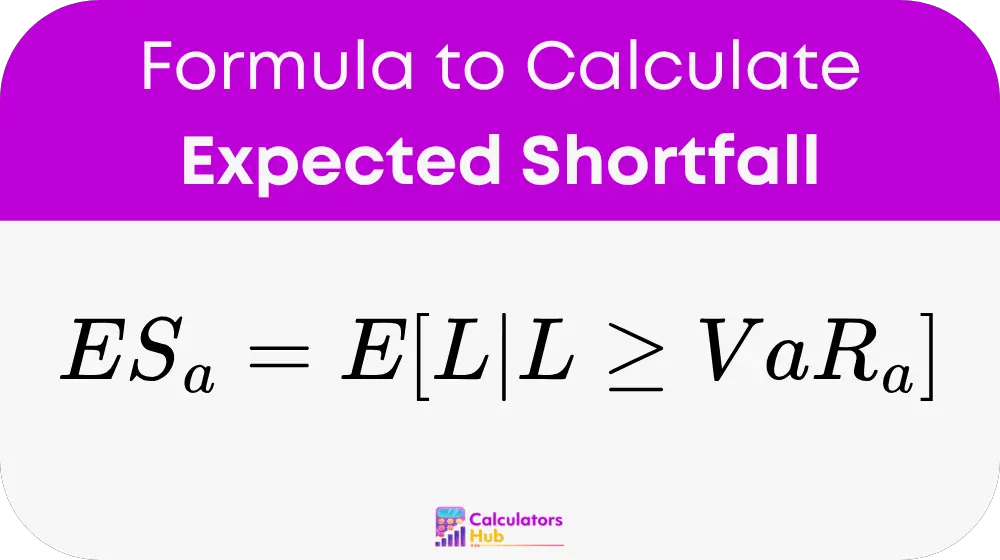
Formula of Expected Shortfall Calculator
Expected Shortfall (ES):
Where:
- E[L | L ≥ VaRₐ] is the expected loss if the loss L exceeds the Value at Risk VaRₐ
- VaRₐ is the loss threshold at confidence level α (like 0.95 or 0.99)
- L is the random variable for loss
For a continuous distribution:
ESₐ = (1 / (1 − α)) × ∫ from α to 1 of VaRᵤ du
- This form calculates the average VaR across the worst-case tail of outcomes.
- It integrates the potential extreme losses from the VaR level up to the 100% mark.
For a normal distribution:
If losses follow a normal distribution:
ESₐ = μ + (σ × φ(zₐ)) / (1 − α)
Where:
- μ is the mean of the loss distribution
- σ is the standard deviation
- zₐ is the z-score for the confidence level α
- φ(zₐ) is the standard normal probability density at zₐ
This form makes the calculation easier when assuming a normal loss distribution.
Table of Common Risk Terms and Shortfall References
| Confidence Level (α) | Z-Score (zₐ) | φ(zₐ) | ES (as a multiple of σ, Normal Distribution) |
|---|---|---|---|
| 90% | 1.2816 | 0.1755 | 1.75 × σ + μ |
| 95% | 1.6449 | 0.1030 | 2.06 × σ + μ |
| 99% | 2.3263 | 0.0266 | 2.66 × σ + μ |
| Helpful Tip | Description |
|---|---|
| φ(z) | Use standard normal distribution table |
| ES in % terms | Divide final ES by investment value |
| Use daily σ for daily ES | Adjust time window as needed |
These figures are often used in regulatory reporting, risk strategy documents, and internal capital models.
Example of Expected Shortfall Calculator
Let’s say you have an investment portfolio with a normal loss distribution:
- Mean daily loss (μ): $0
- Standard deviation (σ): $100,000
- Confidence level: 95% (α = 0.95)
First, find the z-score for 95%: zₐ = 1.6449
Then find φ(zₐ) = 0.1030
Now plug into the normal ES formula:
ESₐ = μ + (σ × φ(zₐ)) / (1 − α)
ESₐ = 0 + (100,000 × 0.1030) / (1 − 0.95) = (10,300) / 0.05 = $206,000
So, the expected loss on your worst 5% of days would average around $206,000.
Most Common FAQs
This is a financial risk calculator used to measure tail risk or extreme downside exposure beyond the Value at Risk (VaR) threshold.
Yes, it provides more information. While VaR only tells you the threshold of extreme losses, Expected Shortfall tells you the average size of those losses, which is more useful for planning.
Yes. You can use the general formula for continuous distributions, but it may require numerical integration or simulation techniques if you’re not assuming a normal distribution.