The Deadweight Loss Calculator helps users quantify the loss of economic efficiency when markets are not operating at perfect equilibrium due to external interventions like taxes or subsidies. It simplifies the process of estimating the economic welfare lost, which is essential for analyzing the effects of economic policies and making informed decisions.
Formula of Deadweight Loss Calculator
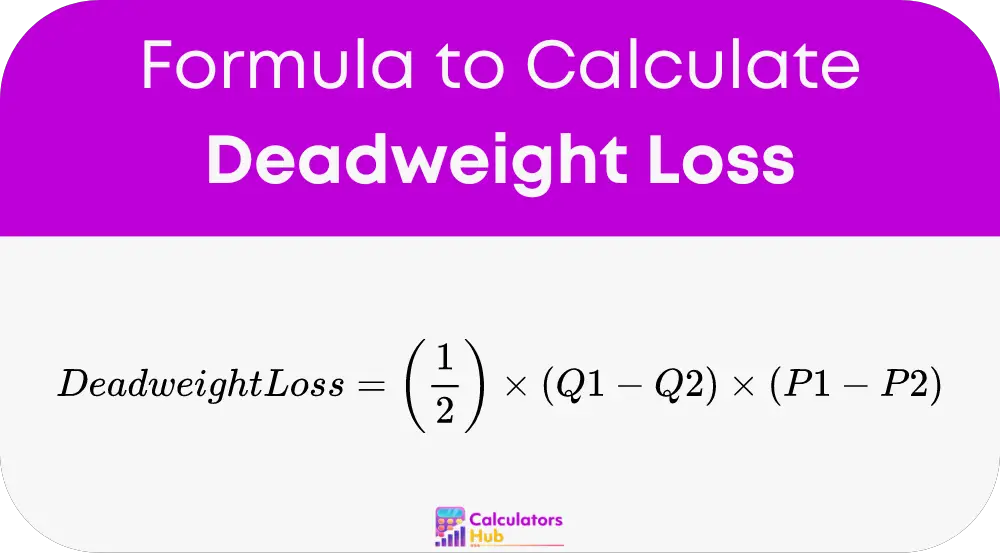
The formula for calculating deadweight loss is:
Here’s what each term represents:
- Quantity at Equilibrium (Q1): The quantity of goods bought and sold where supply equals demand before any tax or subsidy.
- Quantity after Tax/Subsidy (Q2): The new quantity transact after the tax or subsidy has been apply.
- Price at Equilibrium (P1): The market price where supply equals demand without any external interventions.
- Price after Tax/Subsidy (P2): The price after the market adjusts to the tax or subsidy.
This formula calculates the area of the triangle formed between the supply and demand curves before and after the tax or subsidy, representing the loss in total surplus.
Table of General Terms
| Term | Definition |
|---|---|
| Deadweight Loss (DWL) | The loss of economic efficiency that occurs when the equilibrium outcome is not achieved due to market distortions such as taxes or subsidies. |
| Equilibrium Price (P1) | The price at which the quantity of goods supplied equals the quantity of goods demanded, without external interventions. |
| Equilibrium Quantity (Q1) | The quantity of goods bought and sold at the equilibrium price before any taxes or subsidies are applied. |
| Price After Tax/Subsidy (P2) | The price of goods after taxes or subsidies have been applied, altering the original market equilibrium. |
| Quantity After Tax/Subsidy (Q2) | The quantity of goods bought and sold after the imposition of taxes or subsidies. |
| Supply Curve | A graph showing the relationship between the price of a good and the quantity of that good that sellers are willing to supply. |
| Demand Curve | A graph showing the relationship between the price of a good and the quantity of that good that consumers are willing to purchase. |
| Surplus | The amount by which the quantity of a good that is supplied exceeds the quantity demanded, or vice versa, depending on the context. |
| Tax Burden | The distribution of tax payments among buyers and sellers; the tax can shift the supply or demand curve, leading to changes in the market equilibrium. |
Example of Deadweight Loss Calculator
Imagine a market where the equilibrium price of a product is $10, and the quantity is 100 units. After a tax is introduce, the price rises to $12, and the quantity decreases to 80 units. Using our formula:
Deadweight Loss = (1/2) * (100 – 80) * (12 – 10) = 20
This calculation shows that the tax leads to a deadweight loss of $20. Which represents the economic welfare that is loss due to the tax.
Most Common FAQs
Deadweight loss is typically cause by inefficiencies in the market such as taxes, subsidies, tariffs, price ceilings. Floors that prevent free market equilibrium.
Understanding deadweight loss helps evaluate the true cost of economic policies. Can guide decisions towards minimizing these losses, leading to more efficient market outcomes.