La Calculadora de Diferencia de Proporciones ayuda a determinar la significancia estadística de la diferencia entre dos proporciones de muestras independientes. Esta herramienta se utiliza ampliamente en evaluación de la hipótesis, investigación de mercado, por Ensayos y ciencias sociales para comparar datos categóricos entre diferentes grupos. Al calcular la puntuación Z, los usuarios pueden evaluar si la diferencia observada en proporciones es estadísticamente significativa o se debe a una variación aleatoria.
Calculadora de fórmulas de diferencia de proporciones
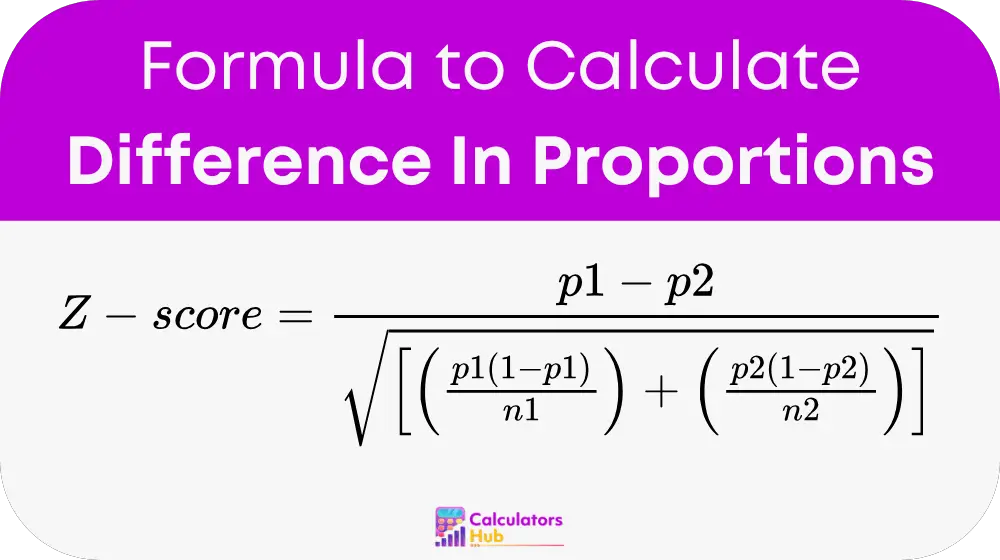
La fórmula para calcular el puntaje Z para la diferencia de proporciones es:

dónde:
- p1 es la proporción del primer grupo (x1 / n1)
- p2 es la proporción del segundo grupo (x2 / n2)
- n1 es el tamaño de la muestra del primer grupo
- n2 es el tamaño de la muestra del segundo grupo
- x1 y x2 son el número de éxitos en cada grupo
Esta fórmula calcula la desviación estándar de la diferencia de proporciones y determina la puntuación Z, que ayuda en la prueba de hipótesis.
Tabla de referencia de diferencias de proporciones
Esta tabla proporciona valores comunes para pruebas estadísticas y comparaciones entre diferentes tamaños de muestra.
| Tamaño de la muestra (n1 = n2) | Proporción 1 (p1) | Proporción 2 (p2) | Puntuación Z |
|---|---|---|---|
| 100 | 0.50 | 0.45 | 0.72 |
| 200 | 0.60 | 0.50 | 2.23 |
| 500 | 0.55 | 0.50 | 1.77 |
| 1000 | 0.70 | 0.65 | 2.20 |
| 2000 | 0.80 | 0.75 | 2.74 |
Estos valores proporcionan una referencia para comprender cómo las diferentes proporciones y tamaños de muestra afectan la significancia estadística.
Ejemplo de calculadora de diferencia de proporciones
Un investigador quiere comparar la proporción de clientes que prefieren dos diseños de producto diferentes. De 500 clientes encuestados para el diseño A, el 55 % lo prefirió, mientras que de 500 clientes encuestados para el diseño B, el 50 % lo prefirió.
Usando la fórmula:
Z = (0.55 – 0.50) / √[(0.55(1 – 0.55) / 500) + (0.50(1 – 0.50) / 500)]
Después del cálculo, el puntaje Z es aproximadamente 1.77, lo que sugiere que la diferencia está cerca de la significación estadística en el nivel 0.05.
Preguntas frecuentes más comunes
Comparar dos proporciones ayuda a determinar si existe una diferencia significativa entre ellas, lo que es útil en campos como estudios médicos, encuestas e investigaciones de mercado.
Una puntuación Z absoluta más alta (normalmente superior a 1.96 para un nivel de confianza del 95%) sugiere una diferencia estadísticamente significativa entre las dos proporciones.
Sí, la calculadora de diferencia de proporciones se utiliza con frecuencia en pruebas A/B para analizar la eficacia de diferentes estrategias de marketing, diseños de sitios web y otros experimentos comerciales.