A Forced Outage Rate Calculator is an essential analytical tool used in industrial settings, especially power generation, to measure the reliability of equipment. This calculator determines the probability that a unit, such as a generator or a manufacturing line, will be unavailable due to an unexpected or forced shutdown. By analyzing operational data, it produces the Forced Outage Rate (FOR), a critical key performance indicator (KPI) that reflects an asset's dependability. Consequently, plant managers, engineers, and reliability specialists use this vital metric to track performance, identify problem areas, and make data-driven decisions about maintenance strategies and capital investments.
Forced Outage Rate Calculator Formula Explained
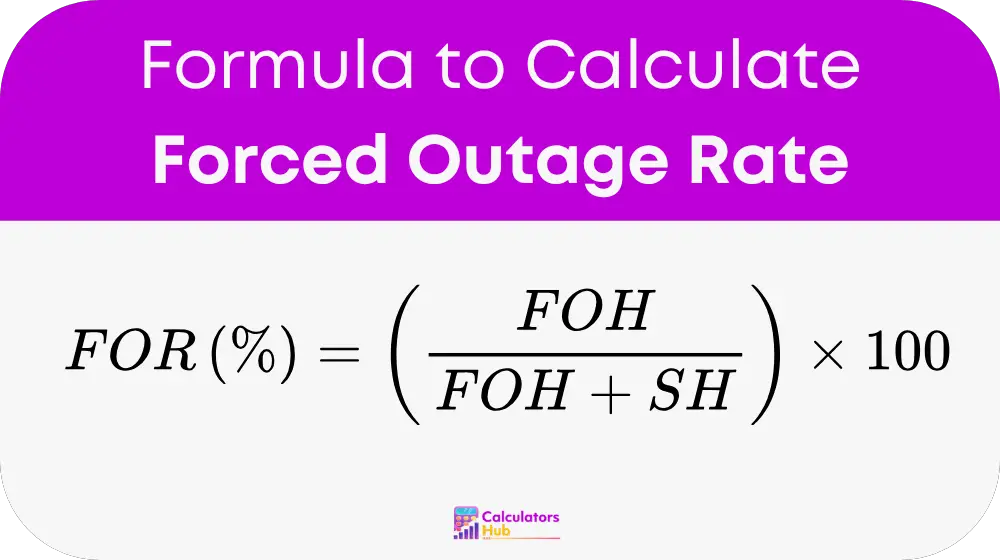
To accurately calculate the forced outage rate, you can use a standard and widely accepted formula. This calculation compares the hours of unplanned downtime to the total time the equipment was demanded for service.
Here is a breakdown of the components:
- FOR = Forced Outage Rate, the final percentage representing the probability of unexpected failure.
- FOH = Forced Outage Hours, which is the total time the unit was down due to an unplanned event.
- SH = Service Hours, which represents the total time the unit was successfully online and operating.
The denominator of the formula, (FOH + SH), is crucial because it represents the total demanded hours—the time the unit was either running or was expected to be running.
Interpreting Your Forced Outage Rate: Benchmarks and Meaning
Understanding your calculated FOR is easier when you compare it against established industry benchmarks. This table provides general ranges that help classify the reliability of your equipment.
| Forced Outage Rate (FOR) | Reliability Class | Common Interpretation |
| 0% - 2% | Excellent | The unit is highly reliable with very few unexpected failures. |
| 2% - 4% | Good | The unit demonstrates strong reliability, meeting typical industry expectations. |
| 4% - 7% | Average | The unit's reliability is acceptable but has clear room for improvement. |
| 7% - 10% | Below Average | The unit experiences frequent unexpected failures that could impact operations. |
| Above 10% | Poor | The unit has significant reliability issues that require immediate investigation. |
Forced Outage Rate Calculator: A Practical Example
Let's walk through an example to calculate the Forced Outage Rate for a power plant turbine over a one-year period. A year contains 8,760 hours.
First, we gather the essential operational data for the turbine.
Service Hours (SH): The turbine was successfully operating for 8,200 hours.
Forced Outage Hours (FOH): The turbine was unexpectedly offline for repairs for a total of 310 hours.
Next, we input these values into the forced outage rate formula.
FOR (%) = [ 310 / (310 + 8,200) ] × 100
FOR (%) = [ 310 / 8,510 ] × 100 = 3.64%
Therefore, the Forced Outage Rate for the turbine is 3.64%. By checking our reference table, we can classify this performance as "Good" equipment reliability.
Frequently Asked Questions About Forced Outage Rate
Forced Outage Rate measures unreliability by showing the probability a unit will fail when demanded. Availability, a broader metric, measures the total percentage of time a unit is ready to operate, considering both unplanned (forced) and planned (scheduled) outages.
The FOR calculation intentionally excludes planned maintenance to isolate and measure the rate of unexpected failures. Since planned downtime is controlled and necessary, removing it from the equation provides a true and focused metric for an asset's reliability during times it is expected to be running.
To improve a high FOR, a business should focus on proactive maintenance strategies. This includes performing a root cause analysis for every failure, enhancing the preventive maintenance schedule, and adopting predictive technologies to identify potential issues before they cause an unplanned shutdown.