The Drop Off Rate Calculator helps you determine the percentage of people or items that start a process but do not complete it. It’s widely used in digital marketing, eCommerce, education, and customer journey analysis. This tool is essential for identifying where users are disengaging — for example, in a sign-up form, online checkout, or content series.
This calculator belongs to the Conversion and Performance Analysis Calculators category. It provides a quick, clear insight into how effectively a process retains users from start to finish.
Understanding the drop off rate is key for optimizing user experience, improving retention, and boosting overall conversion rates.
Formula of Drop Off Rate Calculator
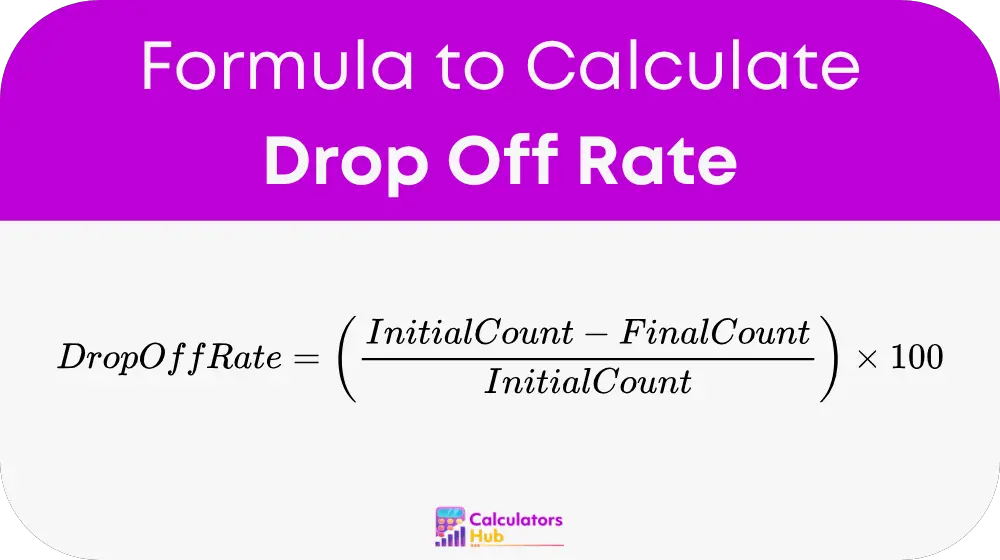
Where:
- Drop Off Rate is the percentage of users/items that did not continue
- Initial Count is the starting number of users/items
- Final Count is the ending number of users/items
This formula gives you a percentage that reflects how many participants or elements failed to complete a desired action or process.
Reference Table: Common Drop Off Rate Scenarios
Here’s a ready-to-use table showing common drop off rate examples based on standard input values:
| Initial Count | Final Count | Drop Off Rate (%) | Scenario Example |
|---|---|---|---|
| 1000 | 800 | 20% | Users exiting after step 1 in a form |
| 500 | 350 | 30% | Abandonment between product view and checkout |
| 200 | 100 | 50% | Course dropouts |
| 100 | 40 | 60% | App onboarding funnel |
| 1000 | 200 | 80% | Webinar attendees vs registrations |
This table offers insights at a glance, helping you detect weak points in your funnel without doing manual calculations.
Example of Drop Off Rate Calculator
Imagine you launch a marketing campaign that gets 1,200 users to your landing page. Only 600 users end up clicking through to the next step.
Initial Count = 1200
Final Count = 600
Apply the formula:
Drop Off Rate = ((1200 – 600) ÷ 1200) × 100
Drop Off Rate = (600 ÷ 1200) × 100 = 0.5 × 100 = 50%
That means half of your users dropped off before moving to the next stage, suggesting a need to optimize your landing page for clarity or user engagement.
Most Common FAQs
It varies by industry, but anything above 50% usually needs attention. Lower rates (10–30%) may be acceptable depending on the process.
You can improve user interface design, shorten forms, clarify calls-to-action, or speed up loading times. Testing different layouts also helps.
No, churn rate refers to customers who stop using a product over time, while drop off rate measures users who don’t complete a specific process.