The Biodiversity Index Calculator evaluates the diversity of species within a given ecological community. It quantifies biodiversity, which is crucial for understanding the health and stability of ecosystems. The calculator uses the Shannon-Wiener Diversity Index to provide a single value that represents the diversity of species in a sample. This index accounts for both the number of species and the evenness of their distribution.
The Biodiversity Index Calculator is useful for ecologists, conservationists, and researchers who need to measure and compare biodiversity across different environments or time periods. It helps in assessing the impact of environmental changes, human activities, or conservation efforts on species diversity.
Formula of Biodiversity Index Calculator
The Shannon-Wiener Diversity Index (H') is calculated using the following formula:
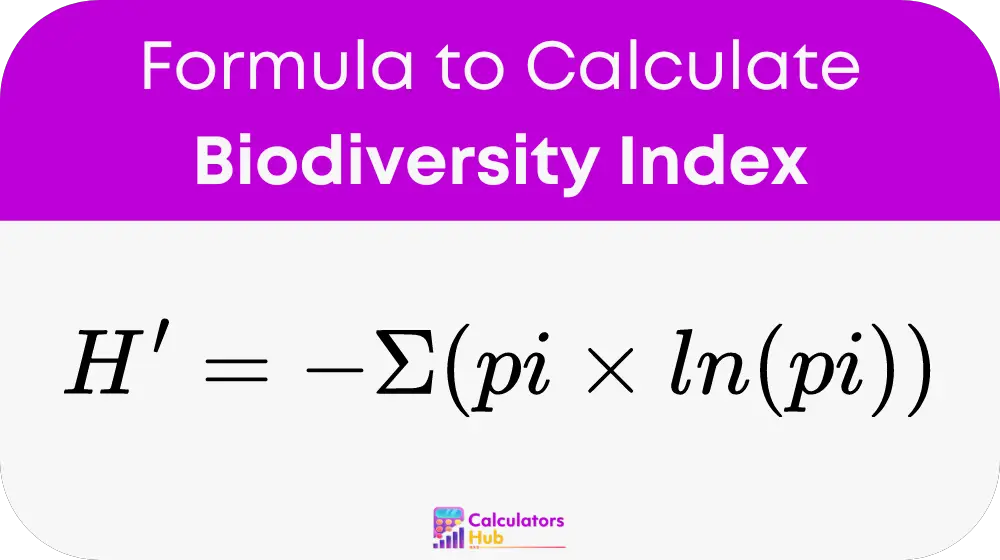
Where:
- H': Shannon-Wiener Diversity Index.
- pi: Proportion of the ith species in the total sample.
- ln(pi): Natural logarithm of the proportion of the ith species.
Steps to Calculate:
- Determine the Proportion of Each Species:For each species, calculate its proportion in the total sample:pi = ni / NWhere:
- ni = Number of individuals of the ith species.
- N = Total number of individuals of all species.
- Calculate the Natural Logarithm:Compute the natural logarithm of each proportion:ln(pi)
- Multiply and Sum:Multiply each proportion by its natural logarithm and sum these values:Σ (pi * ln(pi))
- Apply the Negative Sign:Take the negative of the sum:H' = - Σ (pi * ln(pi))
General Reference Values
To assist with calculations and provide quick reference, here's a table of common biodiversity index values and their interpretations.
| Index Value (H') | Interpretation |
|---|---|
| 0.5 | Low biodiversity |
| 1.0 | Moderate biodiversity |
| 2.0 | High biodiversity |
| 3.0 | Very high biodiversity |
This table provides a general guide for interpreting the Shannon-Wiener Diversity Index values.
Example of Biodiversity Index Calculator
Let's calculate the Shannon-Wiener Diversity Index for a hypothetical ecosystem with the following species distribution:
- Species A: 10 individuals
- Species B: 20 individuals
- Species C: 30 individuals
Steps:
- Determine Proportions:
- Total number of individuals (N) = 10 + 20 + 30 = 60
- Proportion of Species A (pA) = 10 / 60 = 0.167
- Proportion of Species B (pB) = 20 / 60 = 0.333
- Proportion of Species C (pC) = 30 / 60 = 0.500
- Calculate Natural Logarithms:
- ln(pA) = ln(0.167) ≈ -1.791
- ln(pB) = ln(0.333) ≈ -1.099
- ln(pC) = ln(0.500) ≈ -0.693
- Multiply and Sum:
- (0.167 * -1.791) + (0.333 * -1.099) + (0.500 * -0.693)
- ≈ -0.299 + -0.366 + -0.347
- ≈ -1.012
- Apply the Negative Sign:
- H' = - (-1.012) = 1.012
Result:
The Shannon-Wiener Diversity Index for this ecosystem is approximately 1.012, indicating a moderate level of biodiversity.
Most Common FAQs
A higher Shannon-Wiener Diversity Index indicates greater biodiversity within the sample. This means there are more species and a more even distribution of individuals among species, reflecting a healthier and more stable ecosystem.
Yes, the Biodiversity Index Calculator can be used for any type of ecological sample, as long as you have data on the number of individuals for each species. It is widely applicable in various ecological and environmental studies.
The frequency of biodiversity measurement depends on the goals of the study. Regular monitoring can help track changes over time and assess the impact of environmental changes or conservation efforts. In dynamic ecosystems, more frequent measurements may be necessary to capture temporal variations.