The Duncan Index of Dissimilarity Calculator measures how separated two groups are across different areas. It shows if people from one group—like a specific race or income level—live apart from another group. The result, a number between 0 and 1 (or 0% to 100%), tells you how uneven the spread is. A higher number means more separation.
This calculator helps with real-life decisions, like understanding neighborhood diversity, planning housing, or checking fairness in communities. It’s reliable for important tasks, like studying social trends or making policy choices. Want to know how it’s calculated? Let’s check out the formula next.
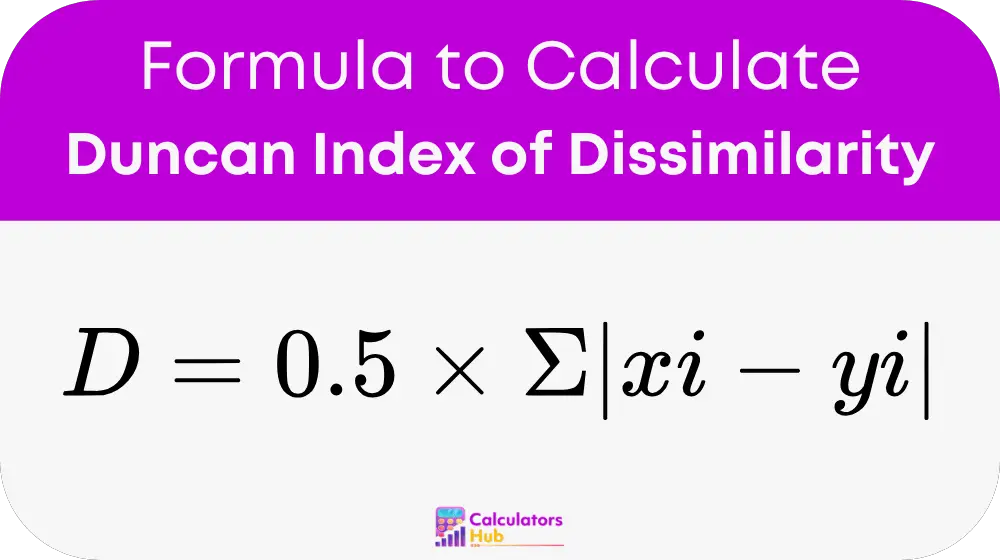
Formula for Duncan Index of Dissimilarity
The formula for finding the Duncan Index is simple:
地点:
- D = Duncan Index of Dissimilarity (ranges from 0 to 1)
- xi = Proportion of population group X in area i
- yi = Proportion of population group Y in area i
- Σ = Sum across all areas i
- |xi - yi| = Absolute difference between proportions
Percentage Version
To show it as a percentage:
D(%) = 0.5 × Σ|xi - yi| × 100
The result tells you what percentage of one group would need to move to make the two groups evenly spread across all areas. This formula comes from sociology and statistics studies. Now, let’s make it easier with a table.
Quick Reference Table for Duncan Index Values
Why calculate every time? This table shows common Duncan Index ranges and what they mean. It’s a fast way to understand results without math.
| D值 | D (%) | 意 |
|---|---|---|
| 0.0-0.3% | 0到30%优惠 | Low separation—groups mix well |
| 0.3-0.6% | 30到60%优惠 | Moderate separation—some divide |
| 0.6-1.0% | 60到100%优惠 | High separation—groups live apart |
How to Use the Table
- Find your calculated D value.
- Check what it means for group spread.
- Use it to explain your findings.
This table helps with searches like “what does a 40% Duncan Index mean.” For exact results, use the formula. Next, let’s try an example.
Example of Duncan Index Of Dissimilarity Calculator
Suppose a town has three areas with two groups, A and B. Here’s the data:
- Area 1: Group A = 400 (80%), Group B = 100 (20%)
- Area 2: Group A = 300 (60%), Group B = 200 (40%)
- Area 3: Group A = 100 (20%), Group B = 400 (80%)
Total: Group A = 800, Group B = 700
- Find proportions:
- Area 1: xi = 400/800 = 0.5, yi = 100/700 ≈ 0.14
- Area 2: xi = 300/800 = 0.375, yi = 200/700 ≈ 0.286
- Area 3: xi = 100/800 = 0.125, yi = 400/700 ≈ 0.571
- 计算差异:
- Area 1: |0.5 - 0.14| = 0.36
- Area 2: |0.375 - 0.286| = 0.089
- Area 3: |0.125 - 0.571| = 0.446
- Sum and apply formula:
Σ|xi - yi| = 0.36 + 0.089 + 0.446 = 0.895
D = 0.5 × 0.895 ≈ 0.4475
D(%) = 0.4475 × 100 ≈ 44.75%
So, the Duncan Index is 0.45 (or 45%), meaning 45% of one group would need to move for even distribution. This fits research norms.
最常见的常见问题解答
A high number (like 60%+) shows groups live very separately—less mixing across areas.
No, this formula compares two groups only—use other methods for multiple groups.
The 0.5 adjusts the total difference so the result shows the minimum moves needed.