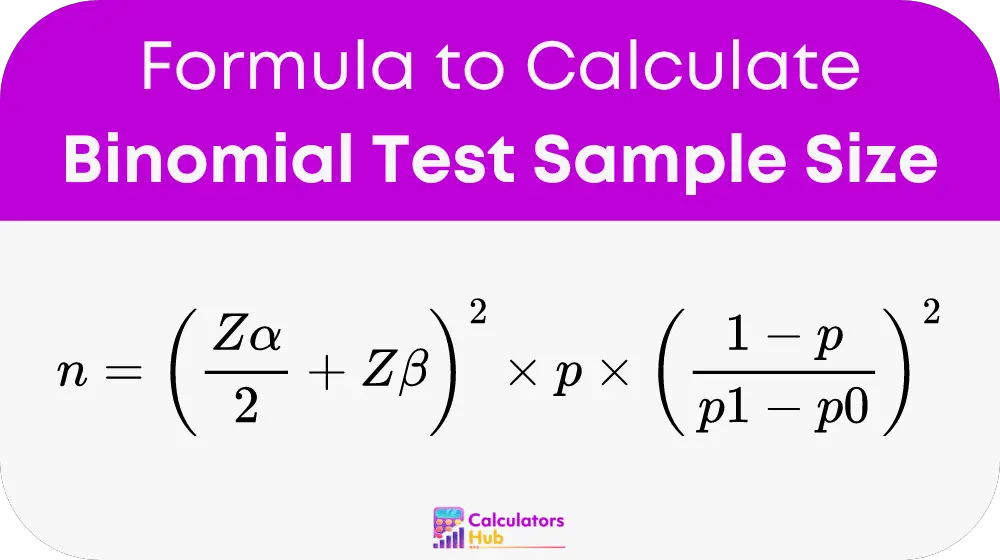
The Binomial Test Sample Size Calculator determines the required sample size for a binomial test to ensure that the test results are statistically significant. This calculator is essential for researchers and analysts who need to plan experiments or studies with binary outcomes (success/failure) and want to estimate how many observations are necessary to detect a significant effect or difference with a specified level of confidence and power.
The sample size is a critical factor in the design of a study, as it influences the ability to detect true effects and the precision of the results. The Binomial Test Sample Size Calculator helps in determining the appropriate number of samples needed based on desired confidence levels, statistical power, and proportions of success under different hypotheses.
Formula
To calculate the required sample size, use the following formula:

Where:
- n: Required sample size.
- Zα/2: Z-score for the desired confidence level (α). For example, a Z-score of 1.96 corresponds to a 95% confidence level.
- Zβ: Z-score for the desired power (β). For instance, a Z-score of 0.84 corresponds to 80% power.
- p: Estimated proportion of success in the population.
- p1: Proportion of success under the alternative hypothesis.
- p0: Proportion of success under the null hypothesis.
This formula provides a precise calculation of the sample size required to achieve statistically significant results given the parameters of your study.
General Reference Values
Here’s a table that provides examples of Z-scores for different confidence levels and power values. This table helps quickly determine the appropriate Z-scores without complex calculations.Confidence Level (α) Zα/2 Value Power (β) Zβ Value 90% 1.645 80% 0.842 95% 1.960 85% 1.036 99% 2.576 90% 1.282
This reference table simplifies the process of determining Z-scores for various confidence levels and power requirements.
Example
Let’s work through an example to see how to use the Binomial Test Sample Size Calculator.
Scenario:
You want to conduct a study to determine if a new drug has a significant effect compared to a placebo. Expect a proportion of success (improvement) in the placebo group to be 0.30 (p0 = 0.30), and you hope to detect an improvement to a proportion of 0.40 in the drug group (p1 = 0.40). You want to achieve a 95% confidence level and 80% power.
Calculation:
- Zα/2 for a 95% confidence level = 1.96
- Zβ for 80% power = 0.84
- p (estimated proportion of success) = 0.35 (average of p0 and p1)
Plug these values into the formula:
n = (1.96 + 0.84)² * 0.35 * (1 – 0.35) / (0.40 – 0.30)²
n ≈ 7.84 * 0.2275 / 0.01 ≈ 177.68
Result:
You need approximately 178 participants in each group to detect a significant difference with 95% confidence and 80% power.
Most Common FAQs
Sample size is crucial because it affects the test’s ability to detect significant differences between groups. A larger sample size increases the precision of the estimates and the likelihood of detecting a true effect, while a smaller sample size may lead to inconclusive or unreliable results.
The Z-scores depend on your desired confidence level and power. For a common confidence level of 95%, use a Z-score of 1.96. For a typical power of 80%, use a Z-score of 0.84. Adjust these values based on your specific requirements.
Yes, the calculator can be used for any proportion values, as long as they are between 0 and 1. Ensure that the proportions under the null and alternative hypotheses are accurately estimated to get precise sample size recommendations.