Vue d'ensemble Calculateur de l'indice de sécheresse is a scientific tool used to measure the dryness or wetness of a region over a specified period. It provides an important metric known as the Standardized Precipitation Index (SPI), which helps detect the presence, intensity, and duration of drought conditions. This tool is widely used in la science du climat, l'agriculture, gestion des ressources en eau et Planification des catastrophes.
The calculator belongs to the Climate and Weather Analysis Calculator category. By analyzing historical precipitation data, the SPI value generated by the calculator makes it easier to compare conditions across different locations and fois periods, regardless of climate variability.
Government agencies, environmental scientists, and farmers rely on this tool to assess risk, make water management decisions, and prepare for extreme weather events like droughts or floods.
formula of Drought Index Calculator
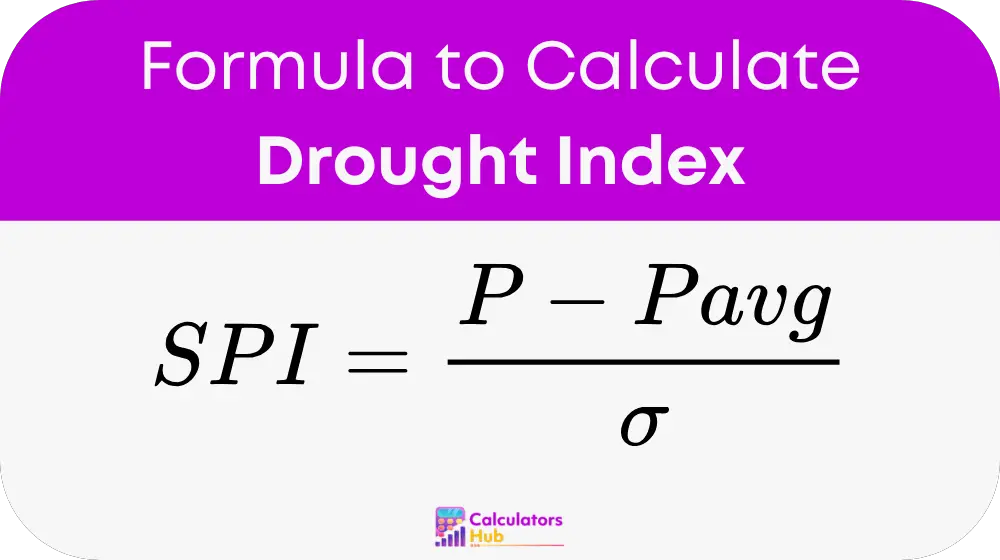
Où :
SPI is the drought index value
P is the precipitation for the period being assessed
Pavg is the long-term average precipitation for that period
σ is the standard deviation of precipitation for that period
This formula uses a normalized distribution of precipitation data. The output SPI value shows how unusual the current precipitation level is when compared to historical data. Positive SPI values indicate wet periods, while negative values indicate dry periods.
SPI Classification Table
| SPI Value Range | Classification |
|---|---|
| ≥ 2.0 | Extremely wet |
| 1.5 à 1.99 | Très humide |
| 1.0 à 1.49 | Modérément humide |
| -0.99 à 0.99 | Near normal |
| -1.0 à -1.49 | Moderately dry |
| -1.5 à -1.99 | Severely dry |
| ≤ -2.0 | Extrêmement sec |
This classification system helps quickly identify the severity of a dry or wet period, which is crucial in managing drought response strategies.
Drought Index Reference Table
Here’s a general lookup table to guide users when they don’t want to perform the calculation manually:
| Precipitation (P) mm | Pavg mm | σ mm | SPI Value |
|---|---|---|---|
| 45 | 50 | 5 | - 1.0 |
| 30 | 50 | 10 | - 2.0 |
| 60 | 50 | 5 | 2.0 |
| 52 | 50 | 2 | 1.0 |
| 50 | 50 | 5 | 0.0 |
| 40 | 50 | 5 | - 2.0 |
This table helps users estimate their SPI value based on typical precipitation patterns and historical records.
Example of Drought Index Calculator
Let’s say a location received 40 mm of rainfall over a 1-month period. The précipitations moyennes for that month based on long-term data is 50 mmainsi que, écart-type is 5 mm.
Appliquez maintenant la formule :
SPI = (P – Pavg) ÷ σ
SPI = (-10) ÷ 5 = -2.0
An SPI of - 2.0 means the region is experiencing extrêmement sec conditions. This would likely trigger drought alerts and the need for water conservation measures.
FAQ les plus courantes
A value between -0.99 and 0.99 is consider Ordinaire, meaning there is no drought or excessive rainfall.
Yes. The SPI can be calculate over 1-month, 3-month, 6-month, or even 24-month periods depending on the drought monitoring goals.
SPI is one of the most commonly use indices because it is simple, flexible, and comparable across climates. However, for soil moisture or crop health, other indices might also be use alongside SPI.